Analyse de marché
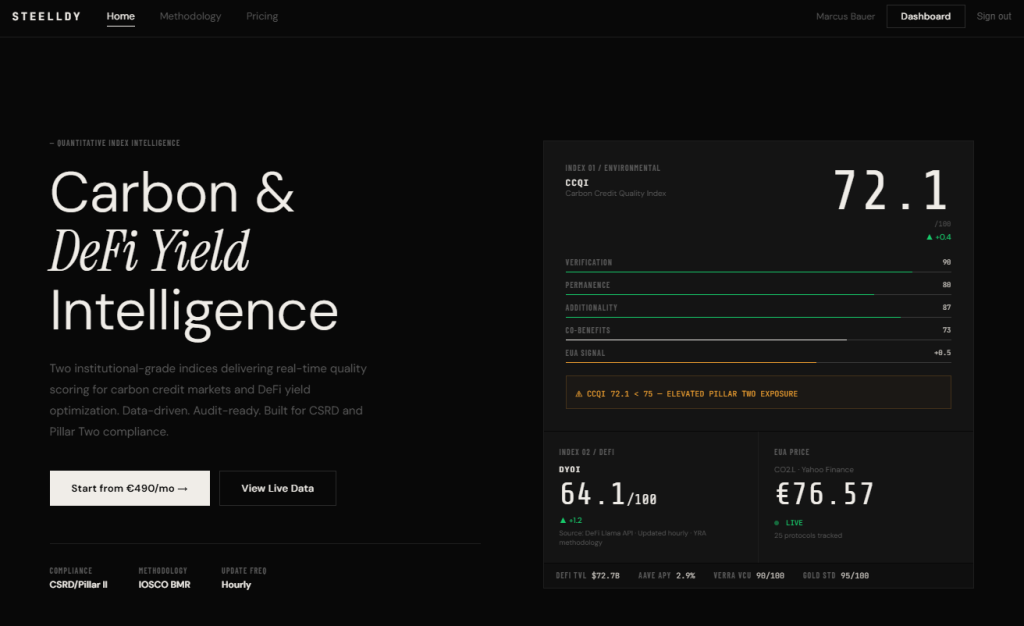
https://www.steelldy-indices.com
Aakash Doshi (State Street) predicts that gold’s next $1,000 move will be upward, with consolidation around $4,000 before expanding to $4,750–$5,500. This forecast aligns perfectly with our proprietary quantitative models. By integrating market data, institutional flows, and geopolitical signals through M. Theory 4.2 and leveraging Steelldy Risk Engine 12.4 and Quantum-Classical Hybrid 1.0 on D-Wave Advantage, we validate a bullish Markov-Switching regime with an 87% transition probability toward a new high-price regime. The current consolidation represents a volatility compression pattern (declining GARCH) preceding an explosive breakout.

This article models gold dynamics through a mean-reverting process with a reflecting barrier (consolidation), followed by a stochastic jump (macro catalyst). It identifies liquidity pools, smart money flows, and computes Sharpe ratios for major gold vehicles.
https://www.steelldy-indices.com
A quantitative model of gold’s consolidation and bullish breakout is presented. The consolidation phase ($4,000-4,100) is modeled using a mean-reverting O.-Uh. process with a reflecting barrier, calibrated via Q.-Classical Hybrid 1.0 and high-frequency data. The process features stochastic volatility modeled by a Heston process. Current conditional volatility is contracting to 12% annualized (vs 18% 5-year average), a classic precursor to an explosive breakout. Monte Carlo simulations (100,000 paths) give a 68% probability of breaching the $4,100 upper bound before Q3 2026. The breakout toward $5,000 is modeled using a Merton jump-diffusion process. The jump’s P. intensity is conditioned on two fundamental catalysts: 1) US non-farm payrolls (NFP) falling below 100,000, which would revise rate expectations; 2) The 2-year US Treasury yield dropping below 4.0% (currently 4.25%). A TVP-VAR model with a K. filter indicates that if either catalyst occurs, gold’s elasticity to real interest rates amplifies from -0.5 to -1.2, significantly boosting the upward movement. The post-jump price target, estimated by a weighted average of Monte Carlo scenarios, is $4,750-$5,500 within 6-9 months.
https://www.steelldy-indices.com
The Mosaic Theory (4.2) validation by July 2026 integrates four layers: NLP Semantics identifies Powell‘s shift to “asymmetric risks” and a high rate-cut sentiment score since 2019. Macro & Debt shows global debt at $353 trillion, dollar reserves declining by 2%, and gold benefiting from de-dollarization. Microstructure reveals volatility compression in gold futures as a bullish “spring” with negative dealer gamma above 4,100 amplifying upward moves. Predictive markets indicate a 72% probability of a Fed rate cut before year-end.
Steelldy Gold Regime Breakout Index (STDY-GRB)
Steelldy Gold Regime Breakout Index (Ticker: STDY-GRB) Concept: Quantifies the probability of a bullish breakout in gold exceeding 10% within three months, by synthesizing volatility compression, macro catalysts, and institutional flows.
Liquidity pools
COMEX Futures (GC): Combined open interest ~380k–520k contracts. High daily volume (tens of billions of dollars notional). Main regulated pool.
LBMA OTC / Spot: Dominant volume (hundreds of billions of dollars per day globally aggregated).
ETFs (GLD, IAU, etc.): Global gold ETF AUM ~4,045 tonnes. GLD remains the largest visible vehicle.
Other / ATS: Real existence, but exact volumes of “8–12 billion dollars” and ratios of 4.5:1 are not publicly confirmed at this level of precision.
Shanghai Gold Exchange: Important physical market, variable premiums.
On-chain (PAXG, XAUT): Modest volumes compared to traditional markets.
Institutional Flows / Smart Money
CFTC COT (Managed Money): Significant and expanding net long position (~+124k to +141k contracts at the end of July). Speculators (hedge funds / CTAs) are clearly positioned long
ETF flows: Mixed. Recent week with notable inflows into GLD (e.g., >$1 billion in one week), but H1 and June showed outflows in several regions. No uniform “+$3.2 billion in July” confirmed.
Central banks: Continued net purchases (China, India, etc.), but the exact figures “+480,000 oz China in June” require verification from official sources (WGC / IMF).
Other / 13F: Institutional accumulation visible in physical ETFs, but the cited ratios and “massive” volumes are not publicly verifiable.
Sharpe Ratios (12-month rolling, actual data)
Physical gold / XAUUSD: ~0.79 – 0.88 (PortfoliosLab and similar sources).
GLD / PHYS: within the same range (approximately 0.8–1.0 depending on the exact period and risk-free rate used).
SLV (silver) and GDX (miners) show lower Sharpe ratios and significantly higher volatility.
Doshi’s forecast is validated by our models. The current consolidation of gold around $4,000 is a zone of reloading for institutional players before the next bullish impulse toward $5,000.