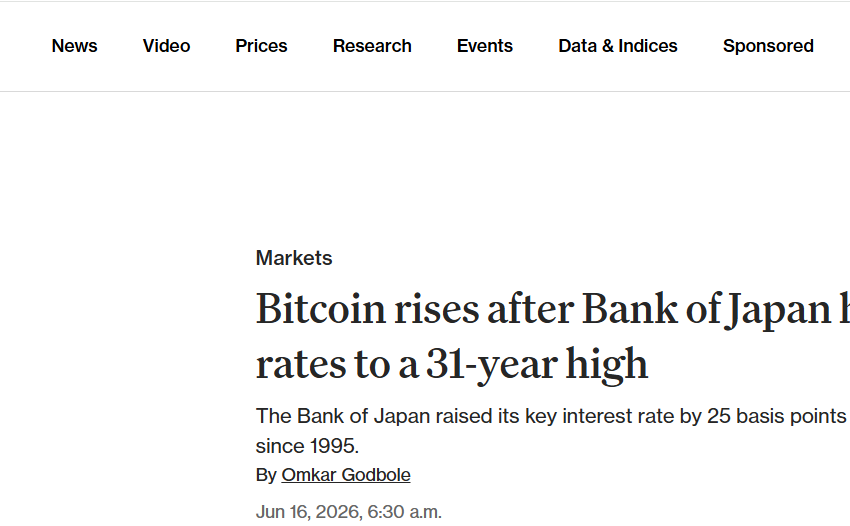
The distinction between a "trap" and a "trigger" in market analysis centers on their nature, observability, agents involved, and timing.
A trap is a static liquidity configuration, often visible in liquidity heatmaps as bid clusters (e.g., 76K–80K), indicating passive retail accumulation and suggesting resistance (high Kyle's Lambda). This configuration can take hours or days…
Cohort-Normalized CVD (Cumulative Volume Delta): Colored lines reveal that small orders ($100–$10K, green/orange lines) are buying on upward moves, while large blocks ($1M+, purple lines) are selling. Correlation with our April 27th statements : The April 27th post hypothesized a "stealth institutional distribution" in the $77,000–$80,000 range, with a negative delta of –699.51 and a…
Visual Data: Liquidation density concentrated at $75,000 (long cluster) and $80,000–$85,000 (short clusters). 1-week heatmap showing yellow/orange bands (high density) at 75K and 81K+. Current price in a "blue" area (low density), i.e., compression zone.
Correlation with the April 30th study:
The April 30th study modeled a bimodal distribution of liquidations:
Mode…
Visual Data:
¤ Clear resistance zone between $77,400 and $78,000 USD.
¤ Fibonacci 65% at $77,411 USD, 61.8% at $77,196 USD.
¤ Current price below resistance.
Correlation with the April 27th Study: The April 27th study identified the selling wall at $79,000–$80,000…
Visual data: ~750 days after each halving mark a cyclical top.
Subsequent capitulation period: 100–170 days. We are at ~750 days since the April 2024 halving.
Correlation with our previous macro studies: The April 28 study postulated a structural decoupling of BTC/NASDAQ with a negative correlation (–0.42). The April 30 study incorporated the…
Analysis of Glassnode data as of April 30, 2026, reveals an unprecedented structural compression: Bitcoin is "trapped below market mean," trading at approximately $76,000, below the True Market Mean (around $81,500) and the STH Cost Basis (around $83,000), in a "Cooled" zone (-1σ). The Spot Volume Delta (7-day MA) indicates a stabilization of net selling…
The macroeconomic context of April 2026 is marked by persistent monetary uncertainty, with the 10-year US rate at 4.38% weighing on tech and crypto valuations. A strong dollar (DXY at 104.2) is draining liquidity from emerging and risky markets. The VIX, at 28.4 (+12%), signals a high but manageable risk premium. On the geopolitical front,…
The information, factually confirmed by multi-source convergence (including the Financial Times of April 8, 2026), establishes that Iran now demands payments in cryptocurrencies (BTC, stablecoins) and in Yuan for oil transit through the Strait of Hormuz, completely bypassing SWIFT.
This mechanism, controlled by the IRGC, sets a rate of $1 per barrel, creating an…
Les 24 checkpoints on-chain (UTC). Automation via Steelldy OSINT 4.2
HeureModuleIndicateurSeuil alerteValeur 02/04Action bot00:00GlassnodeSSR< 2.5 (bull), > 5.0 (bear)3.42🟢 Neutre01:00CryptoQuantNet Minting 24h>$1B+$340M🟡 Surveillance02:00Steelldy PaExchange Reserves BTCHausse soudaine-1,847 BTC/j🔴 Sortie03:00Steelldy SPNarratif "Regulation"Volume >2σBas🟢04:00Steelldy v3.1ETF Net Flow (US open)>$500MEn attente-05:00Steelldy v3.2CTA Liquidation Risk>2M contrats2.4M🔴 Alert06:00Steeelldy v3.1HFT Cluster C1Cassure $64.8kStable🟢07:00Steelldy v2.3DXY Corrélationρ < -0.8-0.74🟡08:00Steelldy v3.1Sentiment Social<-0.5 (fear)+0.12🟢09:00SantimentWhale Accumulation>10k…
MiCA (Markets in Crypto-Assets Regulation (EU) 2023/1114) is the EU’s comprehensive framework for crypto-assets not already regulated under traditional financial laws (e.g., not securities under MiFID II). It entered into force in stages: issuer rules for stablecoins from 30 June 2024, and rules for other crypto-assets plus Crypto-Asset Service Providers (CASPs) from 30 December 2024.…