Skip to content Skip to sidebar Skip to footer

Tag: Nash equilibrium

Crypto Short Squeeze

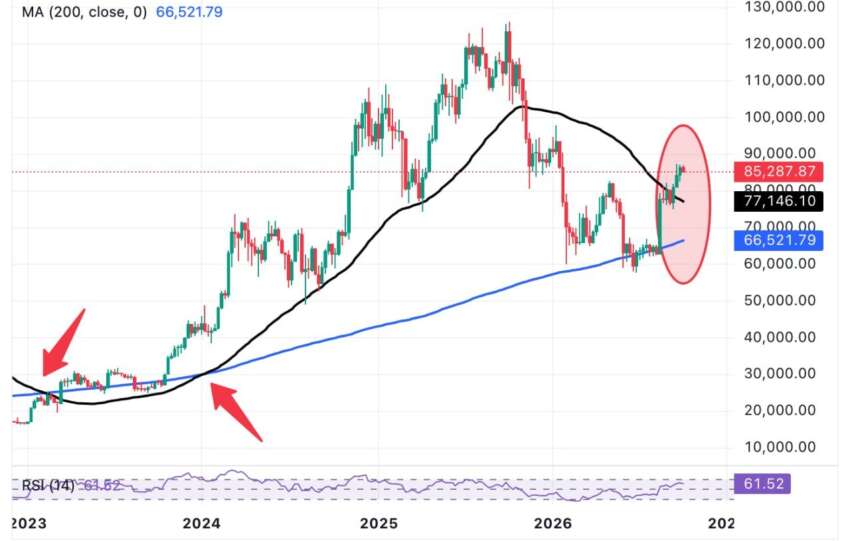
Bitcoin surged to $76,800-$77,600, gaining 6-8% in 24 hours and 20% for the week. The market saw over $4 billion in 24-hour liquidations, marking the most violent short squeeze of 2026. Combined BTC/ETH ETF inflows exceeded $800 million, indicating massive institutional entries. The funding rate shifted from negative to positive, signaling a return of long…

Read more

Colorful display of Zcash, Litecoin, and Bitcoin coins on gradient background.

Stablecoins: $315 billion in circulation, zero dynamic reserve ratings. Why this must change

Price is the last indicator to move The stablecoin market has reached a new milestone: over $315 billion in total market capitalization, serving as the backbone of on-chain settlements, with adoption now extending far beyond the crypto ecosystem alone cross-border payments, corporate treasuries, and collateral for tokenized finance. Yet a massive, under-discussed anomaly persists:…

Read more

Beautiful view of the Jakarta skyline featuring modern skyscrapers and urban landscape.

Global Real Estate as an Ocean of Liquidity & the Institutional Shift SFR / BTR

Global real estate remains the dominant asset class, valued at approximately $393-448 trillion (Savills, 2026 estimates), about 3.3 times the global equity market capitalization and 2.8 times that of bonds. In this context, institutional capital is structurally shifting toward rental income streams (SFR/BTR). The institutional share of the US Single-Family Rental market remains low (2.0-3.1%…

Read more

Silhouette of industrial plant smokestacks against a dramatic sunset sky.

The Carbon Quality Gap: Why a $100 Billion Market Still Trades Without a Benchmark

The voluntary carbon market is on a well-documented trajectory: roughly $2 billion today, heading toward $100 billion by 2030. CSRD reporting, net-zero commitments, and the rise of tokenized credits are pulling institutional money into a market that was, until recently, a boutique affair of project developers and well-meaning corporates. There is just one problem, and…

Read more

SpaceX (SPCX). Probable Correction vs. Long-Term Trajectory

SpaceX (SPCX) faces a probable short-term correction of ≥30% (62-78% probability) from current levels (~$141-146), driven by negative convexity, retail unwind, and liquidity spirals, while long-term (3-10 years) appreciation remains significant. The company is transitioning from a launch and constellation firm to a multi-planetary spatial infrastructure, data, and AI platform with increasing returns and…

Read more

Vector image representing online money transfer going in circles among people on green background

Tokenized Municipal Micro-Bonds

Tokenized Municipal Micro-Bonds. We use the XRPL infrastructure to issue tokenized bonds funded by urban tolls… and local property taxes from specific neighborhoods. Steelldy provides the Risk Engine to rate these micro-bonds in real time via local OSINT. The shift from appreciation tokens to yield structures represents the true institutional inflection point for RWAs. It…

Read more

Gold coins scattered with a stock market graph and a percentage symbol on an orange background.

Why Gold’s Low Sharpe Ratio Masks Its True Value as a Strategic Tail-Risk Hedge

Gold (Sharpe 0.4-0.7, Volatility 12-15%) acts as a reserve asset, inversely correlated with the DXY. Its low Sharpe ratio is due to no carry yield and custody costs, but it offers absolute decorrelation during systemic geopolitical shocks. Physical gold is now central to monetary influence wars (BIS Basel 2024-2025). Steelldy Engine 3.8 and Planet Labs…

Read more

Bitcoin coin standing on a chessboard with silver and brass chess pieces. Concept of strategic digital currency investment.

Beyond the Sharpe Ratio: Why Tail-Risk Hedging Is Essential in Bitcoin’s Fat-Tailed Markets

A long-only Bitcoin strategy with a target Sharpe ratio of 0.8–1.2 and 60–70% volatility is an inherently risky proposition. The asset is high-beta with extreme negative skew and fat tails. While the elevated Sharpe suggests a high risk premium, this masks a pathological risk of ruin during retail capitulation events. The market's inefficiency stems…

Read more

Intricate futuristic circuit board with geometric patterns in teal and gray tones.

Profitability and margin structure. Quantified comparison of SpaceX (Q2 2026) vs hyperscaler models (AWS, Azure/Microsoft Cloud, Google Cloud, Meta AI infrastructure).

https://www.steelldy-indices.com SpaceX has a gross margin of 55.3%, but negative operating and net margins (-1.8% and -6.9%). Only Starlink connectivity is profitable (~+$1.66B OI), while Space and AI segments are loss-making. AWS boasts a 39.4% operating margin (+650 bps YoY), generating ~60% of Amazon's consolidated OI from ~21% of revenue. Microsoft Cloud's gross margin is…

Read more