https://www.steelldy-indices.com
The morning fixing of the 30-year French OAT yield at 4.6926% marks a "phase transition" market event. Cross-referenced with our proprietary risk engines, this level signals a critical threshold for French debt sustainability, with non-negligible probability of a self-fulfilling confidence crisis. Key findings: the 5-year implied probability of a French fiscal accident jumped from…
The transmission mechanism Yen strength → USD/JPY depreciation → yen carry trade deleveraging → global liquidity contraction → BTC risk-asset beta spike (~2–3x) remains empirically robust. However, it is significantly attenuated following the BoJ’s fully delivered and well-telegraphed 25 bps hike to 1.0% (highest since 1995) on 16 June 2026.
Speculative net-short JPY positions elevated…
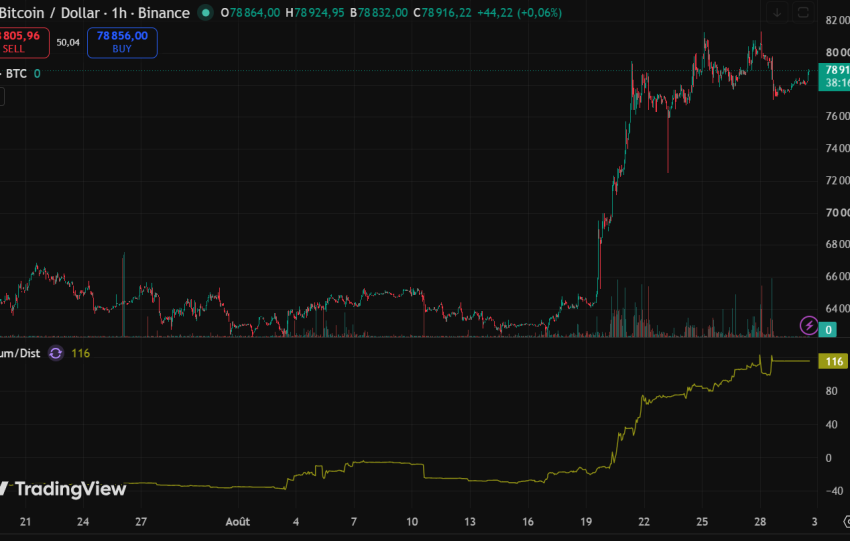
Bitcoin (BTCUSDT) trades at approximately $65,400–66,000, down ~0.8% in the observed session, within a recent consolidation range post a relief bounce from sub-$60k lows earlier in June 2026. The provided chart confirms a 1H/4H structure with MA5/10/20 clustering near $66,200–66,300, recent rejection at $67,255 highs, and downside probe the Fair Value Gap (FVG) zone around…
Executive Summary
Transition risks under 2°C pathways (IEA NZE/APS equivalents) drive structural demand destruction for refined products, compressing refining margins via volume contraction, utilization drops, and policy/carbon cost overlays. Carbon Tracker’s foundational 2017 “Margin Call” analysis projected >50% EBITDA decline by 2035 for ~94% of global capacity under a 2D scenario (oil demand -23%…
Multi-engine analysis suggests that the closure of the Strait of Hormuz, leading to a supply shock of 20 Mb/d (20% of world consumption), has established a regime of "structural energy constraint." This regime is characterized by a high conditional probability of activating restrictive measures on mobility ("energy lockdown"), estimated at 81.3% for 03/31/26, according to…
1. Modélisation quantitative de la crise Ormuz
Qsupply(t)=Q0⋅[1−Φ(σshockt−tshock)]+Qalternative⋅1[t>tresponse]Qsupply(t)=Q0⋅[1−Φ(σshockt−tshock)]+Qalternative⋅1[t>tresponse]
Notre modèle quantitatif de la crise de l'Hormuz simule la dynamique de choc d'offre avec une formule adaptant le pic de Hubbert, où Q 0 est le flux normal (21.5 Mb/j), t shock le début de crise (2 mars 2026), sigma shock la vitesse de disruption…
1. Contexte et synthèse de l’événement
MSCI a décidé (6-01-2026) de ne pas exclure les entreprises détenant des actifs cryptographiques significatifs, comme MicroStrategy (MSTR), de ses indices de référence. Toutefois, une modification de la méthodologie empêche ces titres d'accroître leur pondération dans les indices par le biais de nouvelles émissions d'actions. Cette annonce contredit les…
Les hausses de taux de la Banque du Japon (BOJ) à 0,25% en juillet 2024 et à 0,5% en janvier 2025 a coïncidé avec des chutes respectives de 25% et 30% du BTC, respectivement, en raison des dénouements de carry trade en yen pourrait déclencher un sentiment mondial de prise de risque. Le graphique de…
Analyse de marché