Central bank demand will push gold prices higher in 2026. Despite the second quarter being the worst for gold in 12 years, as a sharp rise in energy prices increased inflation expectations and created the possibility of interest rate hikes, central bank demand will help gold finish the year on a positive note, according to…
According to precious metals market analysts at Heraeus, gold and silver prices are expected to rise soon due to declining oil prices, which ease inflation expectations and reduce bond yields, while developments in the Pacific region suggest a potential shift of the gold market's center of gravity to the East. In their latest review, analysts…
Recent news headlines have shifted as frequently as gold prices, leaving investors questioning market direction. A disconnect between record demand forecasts and sluggish price action adds to the confusion. Damian White and Joe Elkjer analyze the noise to clarify gold’s dynamics, examining whether the recent price decline is a warning or a pause in a…
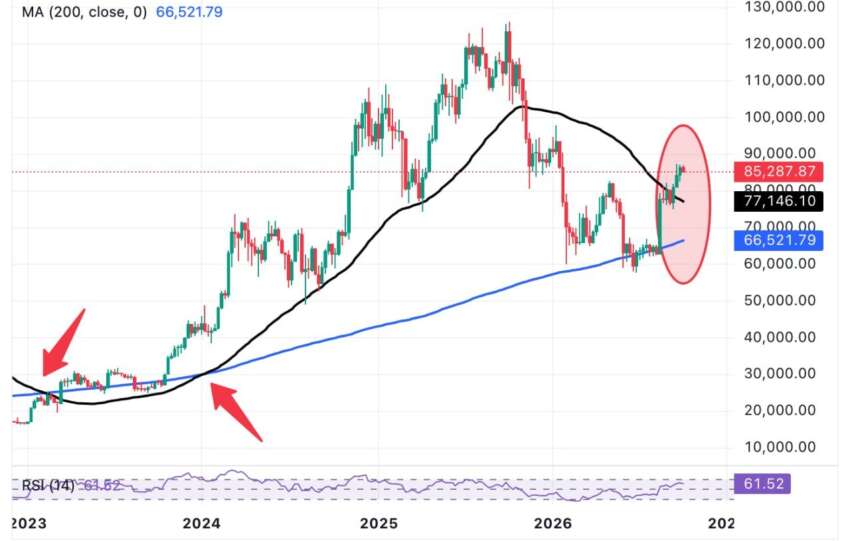
Cohort-Normalized CVD (Cumulative Volume Delta): Colored lines reveal that small orders ($100–$10K, green/orange lines) are buying on upward moves, while large blocks ($1M+, purple lines) are selling. Correlation with our April 27th statements : The April 27th post hypothesized a "stealth institutional distribution" in the $77,000–$80,000 range, with a negative delta of –699.51 and a…
Visual data: ~750 days after each halving mark a cyclical top.
Subsequent capitulation period: 100–170 days. We are at ~750 days since the April 2024 halving.
Correlation with our previous macro studies: The April 28 study postulated a structural decoupling of BTC/NASDAQ with a negative correlation (–0.42). The April 30 study incorporated the…
UBS analysts forecast a significant increase in gold prices, predicting a rise of 20% to reach $6,200 per ounce by the end of 2026, up from current levels. This projection persists despite gold's subdued performance following the conflict with Iran, where it failed to act as a strong safe-haven asset, contrasting with its 65% surge…
Le Bitcoin évolue actuellement dans une structure de compression de volatilité (Squeeze) centrée sur le niveau de support microstructurel des 67 144 USD. Notre moteur de calcul intégré identifie une anomalie de liquidité : un déséquilibre flagrant entre l'absorption institutionnelle (Spot ETF) et la capitulation du levier retail (Perpetuals). La tendance est dictée par la…
La migration des capitaux des fonds monétaires (MMF) de la facilité de Reverse Repo (RRP) de la Fed vers les bons du Trésor US (T-Bills) et le marché des Repos privés est une optimisation rationnelle du rendement ("yield optimization"), et non un mouvement de panique. L'objectif est de capturer un spread de taux positif. Le…
L'analyse de la liquidité au 27 janvier 2026 montre une tension latente, malgré un prix de l'XAGUSD élevé à 106.90, anticipant une inflation structurelle et une demande industrielle fortes. Les marchés monétaires restent stables mais précaires, en phase d'attente ("Watch List") avant un potentiel franchissement de seuils critiques de stress, notamment la Réserve fédérale (Fed)…
La combinaison d'une Fed dovish et d'uneBOJ hawkish crée un "effet ciseaux" amplifiant le risque fatal. Le mécanisme repose sur une forte divergence des taux d'intérêt anticipée entre décembre 2025 et début 2026 (Fed coupant de 25-50 pb, BOJ remontant de 25-50 pb).
Ceci comprime le spread de rendement de 3.25% à 2.25%-2.75%. L'impact…
Analyse de marché