Skip to content Skip to sidebar Skip to footer

Tag: HFT

Crypto Short Squeeze

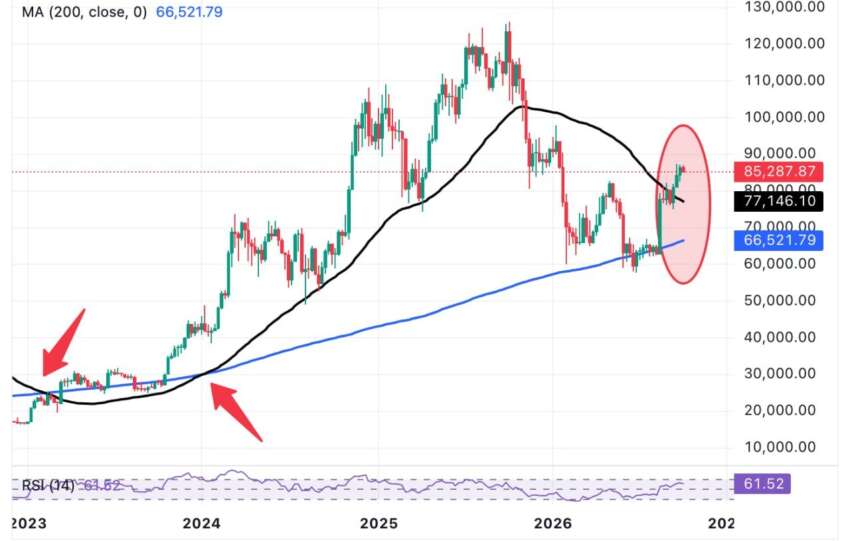
Bitcoin surged to $76,800-$77,600, gaining 6-8% in 24 hours and 20% for the week. The market saw over $4 billion in 24-hour liquidations, marking the most violent short squeeze of 2026. Combined BTC/ETH ETF inflows exceeded $800 million, indicating massive institutional entries. The funding rate shifted from negative to positive, signaling a return of long…

Read more

Colorful display of Zcash, Litecoin, and Bitcoin coins on gradient background.

Stablecoins: $315 billion in circulation, zero dynamic reserve ratings. Why this must change

Price is the last indicator to move The stablecoin market has reached a new milestone: over $315 billion in total market capitalization, serving as the backbone of on-chain settlements, with adoption now extending far beyond the crypto ecosystem alone cross-border payments, corporate treasuries, and collateral for tokenized finance. Yet a massive, under-discussed anomaly persists:…

Read more

Silhouette of industrial plant smokestacks against a dramatic sunset sky.

The Carbon Quality Gap: Why a $100 Billion Market Still Trades Without a Benchmark

The voluntary carbon market is on a well-documented trajectory: roughly $2 billion today, heading toward $100 billion by 2030. CSRD reporting, net-zero commitments, and the rise of tokenized credits are pulling institutional money into a market that was, until recently, a boutique affair of project developers and well-meaning corporates. There is just one problem, and…

Read more

Monochrome image of Ripple coins stacked vertically, symbolizing digital currency.

$315 billion stablecoins: why “trust me” is no longer a reserve policy

The stablecoin market has crossed a symbolic threshold: a market capitalization of over $315 billion. What was, five years ago, a niche tool for crypto traders has become a cash management infrastructure, for funds, fintechs, corporations, and soon, under the effect of the MiCA regulation, for regulated European institutions. Yet the fundamental question remains unchanged:…

Read more

The $16 Trillion Question: Who Measures Tokenization?

The numbers, first. Tokenized real-world assets crossed $30 billion in early 2026, a 300% year-on-year increase : US Treasury debt ($10.7bn), commodities ($5.1bn), private credit ($2.9bn), institutional alternative funds ($2.2bn) leading the mix. Measured against what is coming, $30bn is a rounding error. The 2030 forecasts, by institution: Source2030+ forecastScope noteMcKinsey~$2tnExcludes crypto, stablecoins, deposits,…

Read more

From above ten dollar banknote with inscription and United States treasury building placed on table

RWA Treasuries: The High-Stability, High-Yield Foundation for Modern Crypto Strategies

RWA Treasuries (Sharpe 1.0-1.3 | Volatility 2-3%). Asset representing the tokenization of U.S. Treasury bills (e.g., BUIDL, OUSG). The high Sharpe ratio (1.0-1.3) with negligible volatility (2-3%) makes it the ideal foundation for "Cash-and-Carry" strategies and collateral for HFT strategies. On-Chain Infrastructure and Regulation: The integration of the BIS (tokenization on a unified ledger)…

Read more

China’s Domestic Immersion DUV Lithography Mass Production

On July 27-28, 2026, The Information and then Reuters confirmed the start of volume production of domestic Chinese deep ultraviolet (DUV) immersion lithography tools by Shanghai Aishengna Electronic Technology Group (a state-owned entity created in 2023, with a capital of approximately 7 billion CNY, integrating teams from Yuliangsheng/SiCarrier-Huawei and SMEE). Target: approximately 5 machines…

Read more

Intricate futuristic circuit board with geometric patterns in teal and gray tones.

Profitability and margin structure. Quantified comparison of SpaceX (Q2 2026) vs hyperscaler models (AWS, Azure/Microsoft Cloud, Google Cloud, Meta AI infrastructure).

https://www.steelldy-indices.com SpaceX has a gross margin of 55.3%, but negative operating and net margins (-1.8% and -6.9%). Only Starlink connectivity is profitable (~+$1.66B OI), while Space and AI segments are loss-making. AWS boasts a 39.4% operating margin (+650 bps YoY), generating ~60% of Amazon's consolidated OI from ~21% of revenue. Microsoft Cloud's gross margin is…

Read more

A satellite orbits Earth, showcasing a stunning blue ocean and continents from space.

Structured Quantitative Financial Analysis of SpaceX. Consolidated Accounts for Q2 2026 (period ended June 30, 2026)

Revenue decomposition and growth dynamics for Q2 FY26 Consolidated revenue reached 7,814, representing a 91.94% year-over-year increase from 4,071. The total revenue growth of 3,743 is driven by AI compute capacity rental (approx. +1,880, 50.2% of the increase), Starlink Connectivity (approx. +1,700, 45.4%), and Space Launch & other (residual +163). Key margins for Q2 FY26:…

Read more