Skip to content Skip to sidebar Skip to footer

Site icon Markets

Markets, Markets Data, Private Markets, Equities, Bonds, Stocks, Currencies, Commodities, Crypto, Monetary Policy Radar, Wealth Management, Moral Money, Money, ETF, ETF Hub, Asset Management, Private Equity.

Category image

Markets

Markets, Markets Data, Private Markets, Equities, Bonds, Stocks, Currencies, Commodities, Crypto, Monetary Policy Radar, Wealth Management, Moral Money, Money, ETF, ETF Hub, Asset Management, Private Equity.

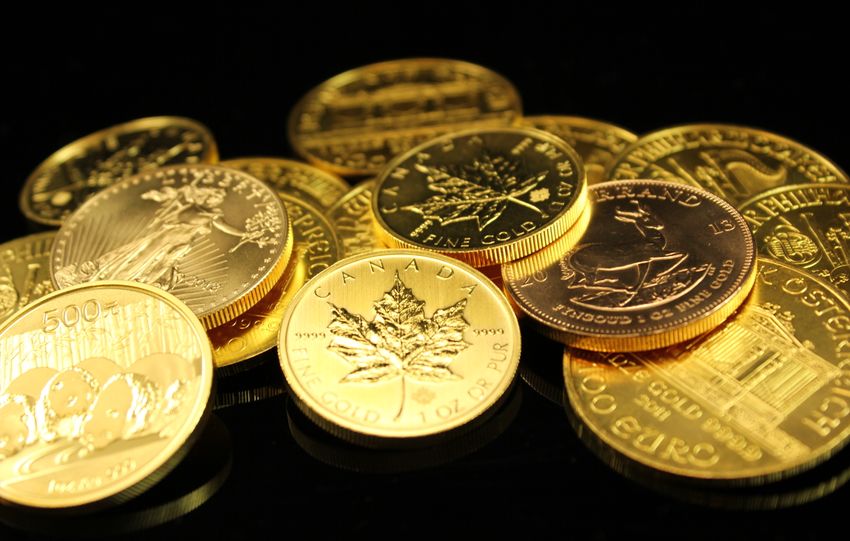
A collection of shining gold bars and coins symbolizing wealth and investment.

Why Diesel Prices Are the Real Story and What They Mean for Gold Investors

The Federal Reserve's decision to raise interest rates by another 25 basis points has drawn market attention, with 10-year Treasury yields exceeding 5%. However, Laurent Morel believe investors are overemphasizing the Fed's actions. While central banks can influence demand through borrowing costs, they cannot address physical supply constraints, no rate hike can produce an extra…

Read more

A stunning aerial view of the iconic Atlantis Hotel on the Palm Jumeirah in Dubai.

Measuring crypto outflows from the UAE, particularly after a geopolitical event (Epic Fury) on February 28, 2026

The hypothesis is that crypto flows become a significant channel for High Net Worth Individuals (HNWI) leaving the UAE. The core issue is that direct capital flow data is unobservable, and all available proxies (e.g., exchange volume, on-chain data, stablecoin supply, real estate sales, surveys, suspicious activity reports) suffer from significant biases. These proxies measure…

Read more

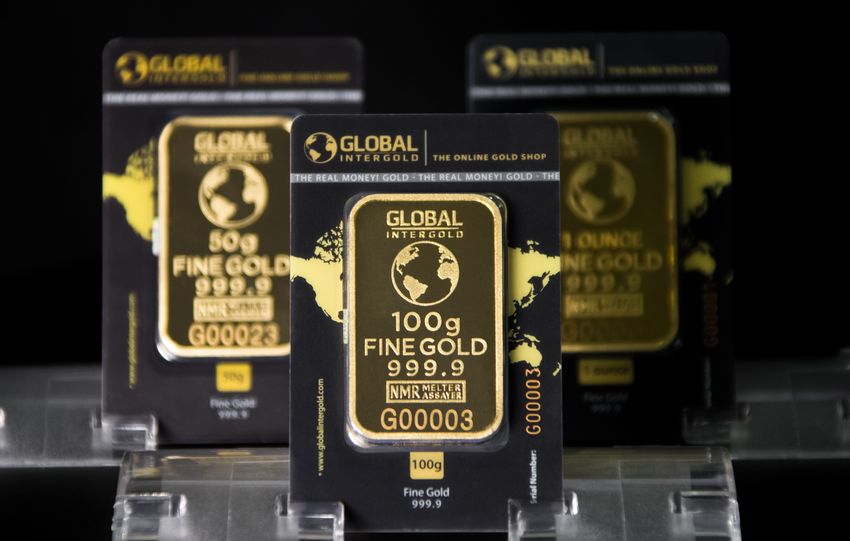
Focused image of 100g Intergold bars showcasing fine gold quality and luxury.

Gold’s +125% Surge Since 2023 Defies Rate Hikes: Fed’s First 2026 Increase Triggers “Buy the Fact” Rebound Toward $4,344

Summary. Quantitative Analysis of Gold Performance (+123% Since September 2023) and 2026-2027 Projections Post-Fed Decision A. Executive Summary. Gold spot price (Sept 18, 2026): $4,344.67, consolidating post-Fed. - Performance since Sept 2023: +125%, indicating a structural bull market. - Fed decision (Sept 16, 2026): Raised rates by 25 bps to 3.75-4.00%, the first hike since…

Read more

Stock market and financial analysis setup with calculator, graphs, and gold coins.

Why Gold Is Hitting Record Highs Despite Higher Interest Rates

The structural relationship between gold and US real rates has broken since 2022. Previously, gold moved inversely to real rates; now, gold reaches all-time highs despite elevated real rates (~2.0%). Central banks from emerging markets have structurally increased gold purchases to ~1,000 tonnes/year (2022-2024), up from ~500 tonnes, shifting away from dollar reserves. This creates…

Read more

Detailed view of brown coffee beans being roasted in a steel machine, capturing the industrial process.

Commodities & ESG taxonomy: real returns in a world of real assets

Thesis. Raw materials are regaining a core portfolio role (hedging a multipolar world and AI electrification), while European ESG shifts from an obligation-based regime to a market-driven one, less reporting, more pricing. Key Data. January 2026 records: gold ~$5,405/oz (2025 annual average: $3,431, +44%), silver >$121/oz, LME copper $13,238/t. Citi scenarios (Q3 2026): Brent…

Read more

Analyzing financial charts with a calculator and chocolate coins.

Gold  against stocks

Gold was indeed a high-Sharpe asset during certain windows from 2025 to early 2026, and long-term bonds did under perform. However, as of September 7, 2026, gold does not "beat tech stocks" over 12 months. NVDA and the S&P have higher TTM returns than those shown in the table. The illustrative recalibration (TTM window,…

Read more