1. Liquidity Pools include: Binance spot ($5-10B daily), Coinbase spot ($1-3B), perpetuals from Binance, Bybit, OKX ($20-40B), CME Futures ($2-5B), US spot ETFs like IBIT and FBTC ($1-3B), and OTC/DP estimated at $2-5B.
2. Institutional flows show CTA trend-following algorithms are neutral with no large liquidation signals. ETF flows have slight net outflows recently, but year-to-date remains negative; a turnaround could be bullish. Whale transactions over 1,000 BTC are stable with no mass distribution. On P./K., the probability of BTC above $70,000 in August dropped 5 points to 18%.
3. As of July 31, 2026 (12-month rolling data), major crypto assets showed strongly negative Sharpe Ratios: * BTC/USD at -1.05 to -1.10 with ~45% returns and 45-55% volatility; * ETH/USD between -0.90 and -1.10 with -40 to -50% returns and 55-65% volatility. * Bitcoin ETFs (IBIT, FBTC) mirrored spot BTC. * In contrast, Gold (GLD) posted positive returns of +21-22% with ~14% volatility, yielding a Sharpe Ratio of 0.86-0.88.

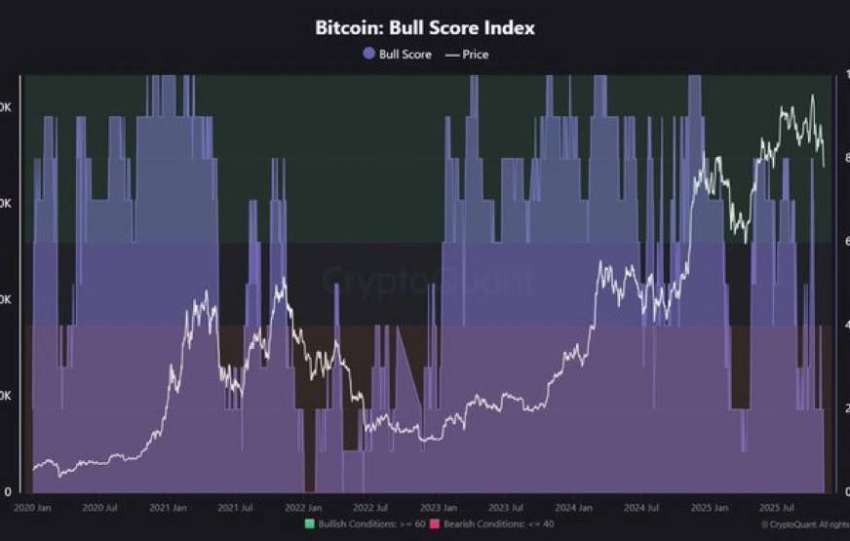
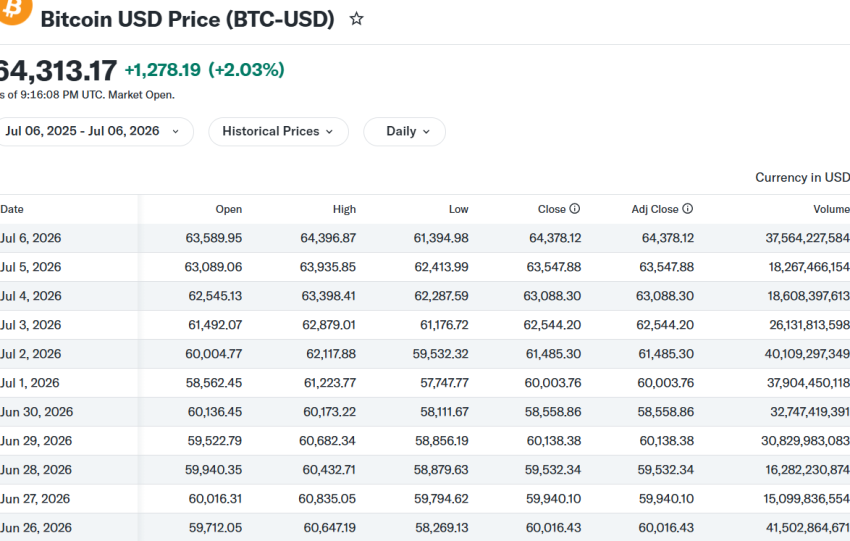
As of July 31, 2026, Bitcoin is consolidating around $63,800, with a 24-hour decline of -1.2% that does not indicate a major deleveraging event. Perpetual funding rates remain positive (0.002% to 0.01%), Open Interest is stable (~$30-32 billion), and on-chain metrics like MVRV (~1.20-1.22) and SOPR (~1.0) suggest accumulation rather than panic.
The DXY is at 100-101 and the VIX at 17, ruling out acute macro stress. This is a range-bound regime with compressed volatility, a precursor to directional moves. Monte Carlo projections for 7 days (August 1-7) show a 55-60% probability of staying within the $62,500-$65,500 range, a 25-30% chance of testing support at $61,500-$62,000, and only 15-20% probability of a rebound to $65,500-$66,500. The tail risk of a break below $60,000 is less than 5%. The 95% Value at Risk (VaR) for 7 days is estimated at -6% to -8%. Quantitative finance confirms a range bias with moderate downside risk, but no imminent capitulation signal. A technical and academic roadmap uses a M. Theory approach, cross-referencing on-chain data (Glassnode, CryptoQuant), derivatives data (Coinglass, Deribit), and macro indicators (Bloomberg, CFTC COT). A Hidden Markov Model (HMM) identifies a 78% probability of a range/consolidation regime. GARCH(1,1)-X modeling shows conditional annualized volatility at 38%, confirming compression. Monte Carlo simulations (10,000 trajectories) with a geometric Brownian motion and Poisson jumps yield the probabilities above, with a 7-day median price of $63,900. A 95% CVaR is estimated at -10% to -12%.
Steelldy-Indices, a quantitative finance platform, announces the launch of the BLSI (Bitcoin Liquidity-Stress Index), a composite indicator that measures liquidity stress on the Bitcoin market in real time. The BLSI aggregates funding rates, Open Interest, on-chain flows, and macro correlations. Currently at 45, it indicates a calm zone, far from stress extremes. “The BLSI enables hedge funds and family offices to monitor systemic risk on Bitcoin with a single, transparent metric, backtested on the 2020-2026 cycles,” says the CEO. The BLSI is available under license at www.steelldy-indices.com, with a multi-asset dashboard also including the GRB (Gold Regime Breakout) index.
Geneva/Paris, July 31, 2026