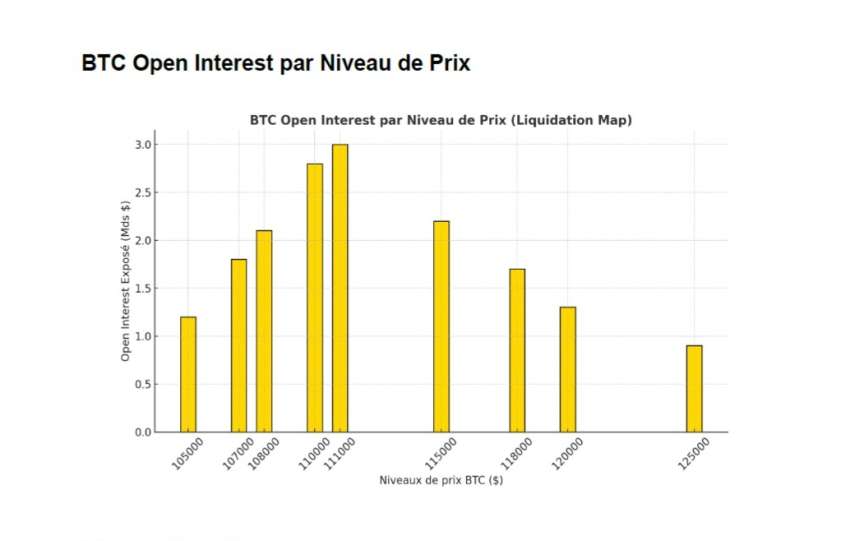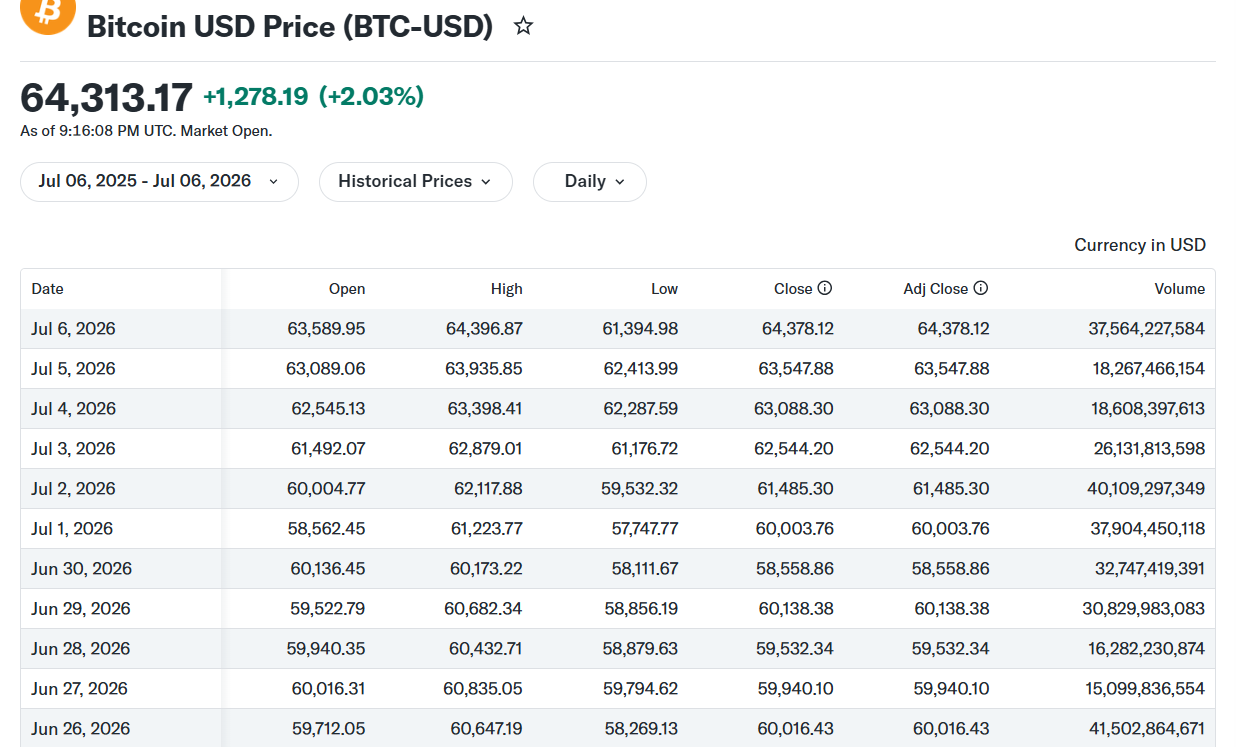
Bitcoin price recently traded between 58-64 kUSD, with a low of ~58.5 kUSD on July 1 and recovery above 60-63 kUSD as of July 6, 2026.
The price action around the psychological/resistance level of 60 kUSD is factual. Institutional accumulation saw whales (wallets with ≥1,000 BTC) accumulate ~270,000 BTC over 30 days in April-May 2026, valued at $16-23 billion, near 59 kUSD. This is the heaviest accumulation episode since 2013, contrasting with spot ETF outflows.
Data from Glassnode, CryptoQuant, Arkham, and analysts like Bitfinex confirm this, aligning with the Kyle framework of massive private informed trader signals.
The concept of Relative Strength (RS) over 300 trading days is standard among institutional asset managers (BlackRock, Bridgewater, Brevan Howard). The RS formula provided is correct: RS > 0 indicates outperformance. The orange (BTC vs basket/SPX-Gold), yellow (Gold), green (SPX), and purple (historical outperformance peak) lines are consistent with sector/asset-class rotation practices. Concurrence with dark pool/ATS flows, CFTC COT, and on-chain data reinforces robustness (Mosaic Theory). Regarding macro context: BTC correlates ~0.45-0.72 with SPX recently, not a pure safe-haven. Gold serves as a complement, trading at ~$4,100-4,200/oz in July 2026 (significant rally). No contradiction with the rotation/RS thesis.
Leave a comment