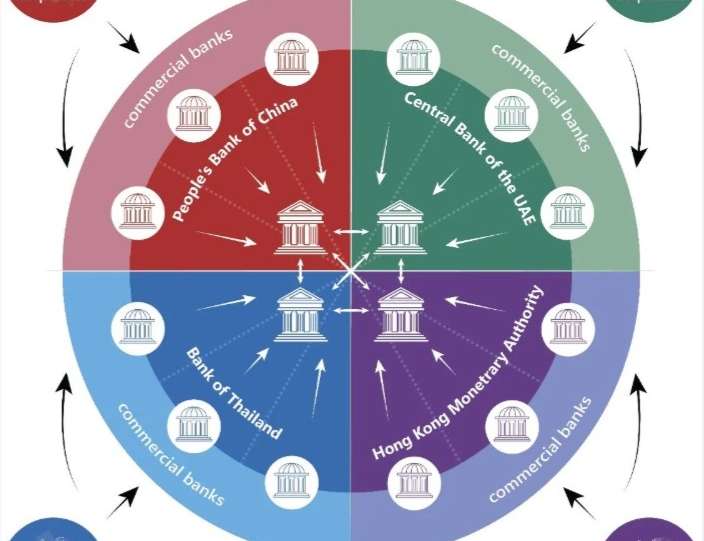
Analyse de marché
Executive Summary
The 3:2:1 crack spread serves as a primary proxy for gross refining margins, calculated as:
where prices are typically futures-settled (e.g., WTI/RBOB/NYH HO for USGC benchmarks; Brent equivalents or regional baskets for Europe).
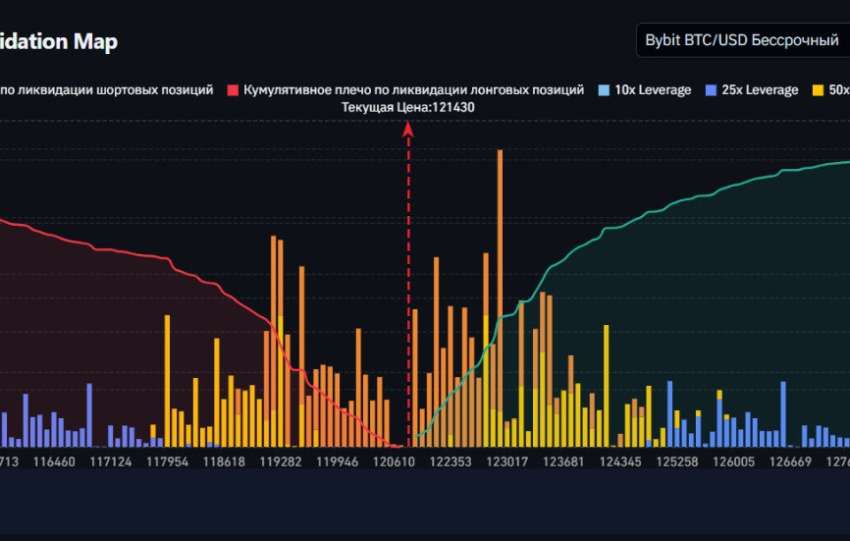
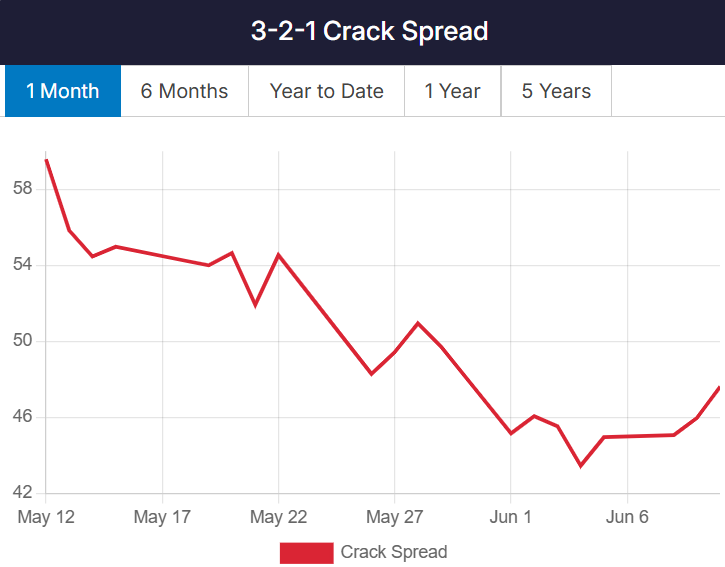
Recent data (as of ~June 10, 2026) shows the US 3:2:1 spread hovering near $46/bbl (elevated vs. historical mid-cycle $10-20/bbl, though volatile post-geopolitical shocks). This contradicts a broad “collapse to $28” but aligns with episodic squeezes: spreads widened sharply in Q1 2026 amid Middle East disruptions (e.g., Iran-related impacts boosting product cracks faster than crude in some windows) before potential normalization pressures.
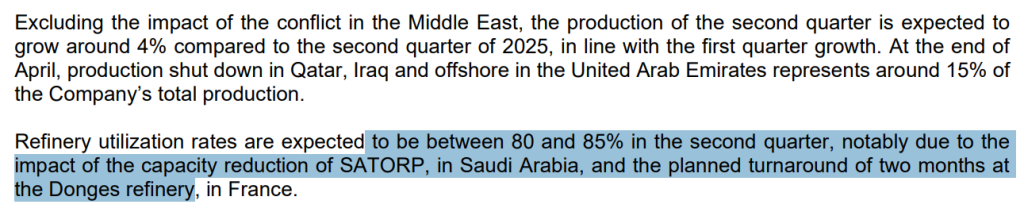
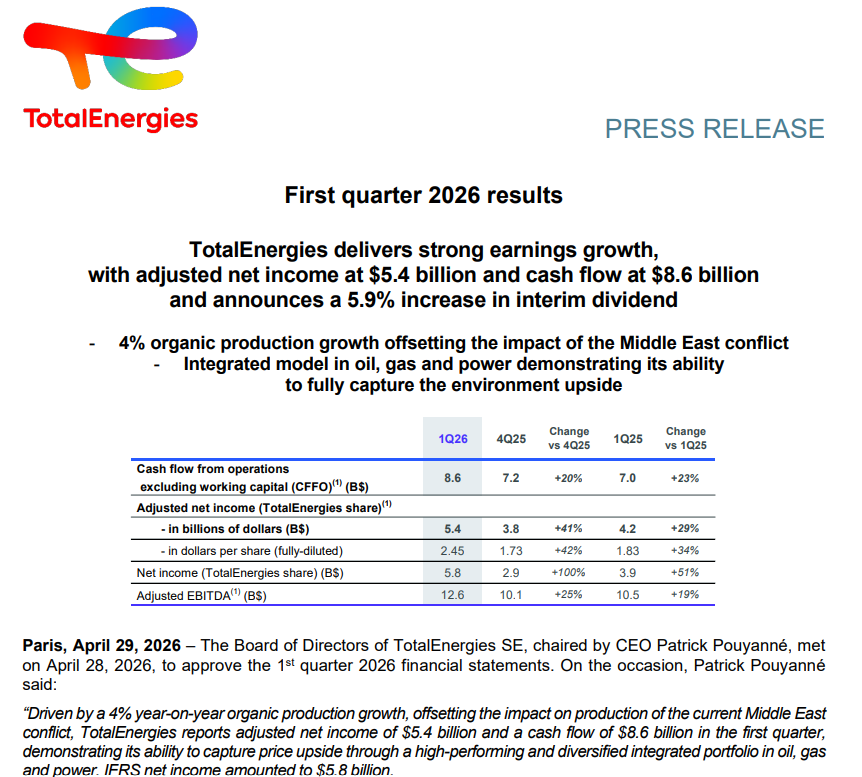
For TotalEnergies, the relevant metric is the European Refining Margin Marker (ERM), a company-specific basket proxy (~$11.4/bbl average in Q1 2026, with March spikes and weaker Jan/Feb). This reflects European complexities (simpler configurations in parts of the portfolio, regulatory costs, and competition from Asian/US complex refiners). Refining & Chemicals adjusted net operating income reached $1.599B in Q1 2026 (strong QoQ on utilization >90% and trading), but Q2 outlook includes utilization drops to 80-85% due to maintenance (e.g., Donges) and potential margin pressure.
Core Thesis (Quantitative): Elevated cracks signal a “stealth windfall” reversal. Reduced runs (supply response) can paradoxically floor near-term crude prices via lower feedstock demand while supporting product prices short-term (inventory draws). However, structural overcapacity risks, demand elasticity, and TotalEnergies’ integrated model (Upstream hedge + trading) position it better than pure-play refiners. Projections incorporate stochastic modeling, cointegration, and real-options frameworks.
1. Mathematical Definition and Decomposition of Crack Spreads
The Gross Crack Spread, a theoretical measure of refining profitability before operational expenses (OPEX), assumes fixed yields, typically around 67% gasoline and 33% distillate for a 3:2:1 ratio. Actual yields, however, depend on refinery complexity, as indicated by the Nelson Complexity Index (NCI), with more complex refineries (NCI 8-15) yielding differently than simpler hydroskimming operations (NCI <6).
The Net Refining Margin provides a more realistic profitability assessment by subtracting OPEX per barrel, transportation and quality differentials, and taxes/compliance costs (like EU ETS or biofuels mandates) from the crack spread. For instance, TotalEnergies calibrates its European Refining Margin (ERM) using a basket of crudes and products along with variable costs specific to the European system.
A $1/bbl increase in their ERM can lead to an annual Net Operating Income (NOI) increase of approximately $0.3-0.4 billion. Volatility in crack spreads is often modeled using Ornstein-Uhlenbeck processes with Poisson jumps, reflecting mean-reverting behavior punctuated by sudden shifts, often due to geopolitical events. This results in historical annualized volatility of around 30-50% and high kurtosis due to supply shocks.
Cointegration analysis, employing methods like Engle-Granger or Johansen tests, reveals that crude oil, gasoline, and distillate prices are integrated of order one (I(1)), meaning their price levels are non-stationary. However, their spreads are stationary, indicating a long-term relationship. This stationarity allows for strategies like pairs trading and hedging. Refiners often hedge their crack spread exposure by selling crack spread futures, which involves buying crude oil futures and selling gasoline and heating oil (HO) futures in specific ratios (e.g., buy 3 crude, sell 2 gasoline + 1 HO).
The Capture Rate, representing the actual realized margin relative to the benchmark crack spread, typically ranges from 70-90% for complex refineries. For specific assets, like TotalEnergies’ European operations, this capture rate might be lower due to their particular configuration and logistical constraints.
2. Drivers of the Current/Recent Squeeze (Multi-Factor Econometric View)
The current/recent refined product squeeze is driven by a multi-factor econometric view. Supply-side issues, including geopolitical events like damage in the Middle East and Russian sanctions, have tightened product availability faster than crude oil, widening cracks in Q1 2026. While global refinery utilization is high (over 90% in the US), Europe has experienced lower or negative utilization at times. Demand elasticity presents a paradox: it’s inelastic in the short term for essential uses like driving and aviation, but elastic in the longer term due to electric vehicles and efficiency improvements.
Lower refinery runs tend to weaken crude oil bids due to reduced input demand, yet gasoline prices can remain firm or rise due to inventory draws. Structural factors include capacity rationalization post-2022, with refineries closing or converting to renewable energy, and limited newbuilds attributed to high capital expenditure and ESG considerations.

Projections from the IEA and OPEC indicate a tightening market from 2027 onwards, but near-term volatility is expected. Inventory levels and seasonality play a role, with summer driving demand and winter distillate needs contributing to backwardation in product markets. Changes in working capital can significantly impact companies; TotalEnergies reported a ~$5 billion impact in Q1. Macroeconomic and policy influences include interest rates from the Fed and ECB, China’s demand, energy transition narratives from forums like WEF/Davos, and financial stability concerns from the BIS regarding commodity financing. A regression framework (quant model) for crack spreads is outlined:
Expected coefficients suggest that a stronger crude price (β1) might lead to lower crack spreads in the short term (lagged products), and higher utilization (β2) would inversely affect crack spreads during periods of oversupply. In the context of BIS and WEF discussions, transition risks are seen as compressing long-term margins. Carbon Tracker-style analysis suggests potential EBITDA drops of over 50% by 2035 under a 2°C warming scenario, driven by demand destruction.

3. TotalEnergies-Specific Exposure and Resilience
TotalEnergies demonstrated strong Q1 2026 performance, with Refining & Chemicals posting $1.599B in Net Operating Income (NOI), a 60% increase quarter-over-quarter, driven by utilization exceeding 90% and elevated Refining Margins (ERM) of $11.4/bbl, particularly in March. Trading activities capitalized on market volatility.
The company’s integrated model proved resilient, with Upstream production averaging 2.55 million barrels of oil equivalent per day (Mboe/d), supported by Middle East ramp-ups and a balanced portfolio including LNG and Power hedges for downstream operations. The outlook for Q2 anticipates utilization between 80-85% due to planned maintenance and the SATORP refinery.
The company’s guidance embeds ERM sensitivity, with approximately $15 billion in net investments projected for 2026, maintaining a gearing ratio around 15%. Robust cash flows are expected across various Brent crude price scenarios, even at $80+/bbl.
TotalEnergies’ diversified portfolio, with a significant downstream component within its integrated structure, features complex assets that are well-positioned. The adoption of replacement cost accounting helps to stabilize financial reporting amidst market fluctuations.
From a fiscal and quantitative perspective, the company actively optimizes its tax structure and gearing. Its operational flexibility is viewed as a source of real-options value, enabling strategic adjustments like run cuts as a hedge against margin volatility.
Discounted Cash Flow (DCF) and Net Asset Value (NAV) analyses indicate that Upstream assets provide a valuation floor, while refining acts as a cyclical overlay. Hedging strategies, analogous to Black-Scholes models for options, are employed for crack spreads.
Applying quantitative risk management techniques akin to major financial institutions (…), TotalEnergies utilizes Monte Carlo simulations. These simulations, incorporating Geometric Brownian Motion and jump processes, model correlated price movements (crude-to-product correlations ranging from 0.7 to 0.9). A 95% one-week Value at Risk (VaR) is calculated for the margin book. Stress tests include scenarios like a 20% crude price increase coupled with a 10% product price increase (widening margins) versus a demand crash scenario, which narrows margins to single digits. Importantly, TotalEnergies’ integrated delta and gamma exposures are noted to be lower than those of pure refining companies, suggesting a more diversified risk profile.

4. Forward Projections and Scenario Analysis (Quantitative Modules)
The company projects a base case of $15-25/bbl refining margins and $7-10/bbl for ERM, with crude oil stabilizing between $60-80/bbl. Annualized cash flow is estimated at over $30B, with an additional $0.4B per $10 increase in Brent crude. A bull scenario anticipates higher cracks ($30-40+) due to persistent supply tightness and low inventories, leading to TotalEnergies outperforming. Conversely, a bear scenario foresees cracks below $10 and reduced utilization from demand slowdowns and OPEC+ unwinding, creating earnings pressure despite crude price floors. Mitigation strategies include trading and portfolio rebalancing. Stochastic projections utilize Hull-White or Schwartz-Smith models, simulating 10,000 paths for commodities, with refining contributions discounted at an 8-10% WACC.