Skip to content Skip to sidebar Skip to footer

Tag: Trader

Close-up of shiny gold bars and coins, representing wealth and fortune.

From $5,600 to $4,100: Why Gold’s 2026 Decline Mirrors Past Bull Market Corrections

After reaching an all-time high in January 2026, gold prices continued to decline during the first half of the year, raising investor concerns about further drops and whether it is an opportune time to buy. While short-term forecasts are uncertain, analysts are more confident in predicting gold's long-term trajectory, citing strong fundamentals despite temporary macroeconomic…

Read more

Why OCBC Cut Its Gold Price Outlook by 15% While Other Banks Stay Bullish

On the last day of June, gold traded at $4,023 per ounce. Oversea-Chinese Banking Corporation (OCBC), a major Southeast Asian bank, lowered its year-end gold forecast from $5,100 to $4,360, citing rising real yields, a stronger U.S. dollar, and a more hawkish Federal Reserve policy. https://www.steelldy-indices.com The bank also reduced its silver forecast by about…

Read more

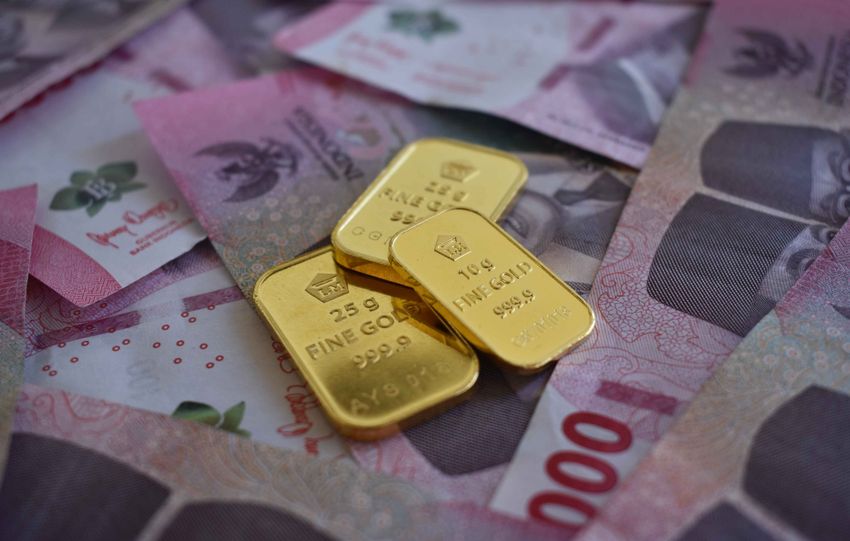
Close-up of gold bars on Thai baht banknotes, symbolizing wealth and prosperity.

Gold vs. Bonds: As Central Banks Hike Rates, Investors Ditch the Yellow Metal for Yield

Gold is currently weakening despite inflation, due to several key factors. In May, Germany’s inflation rate was surprisingly moderate at 2.6% annually, significantly lower than the eurozone’s 3.2%. This deviation from the European trend was primarily driven by a temporary fuel subsidy introduced by the German government, which reduced gasoline and diesel prices. However, this…

Read more

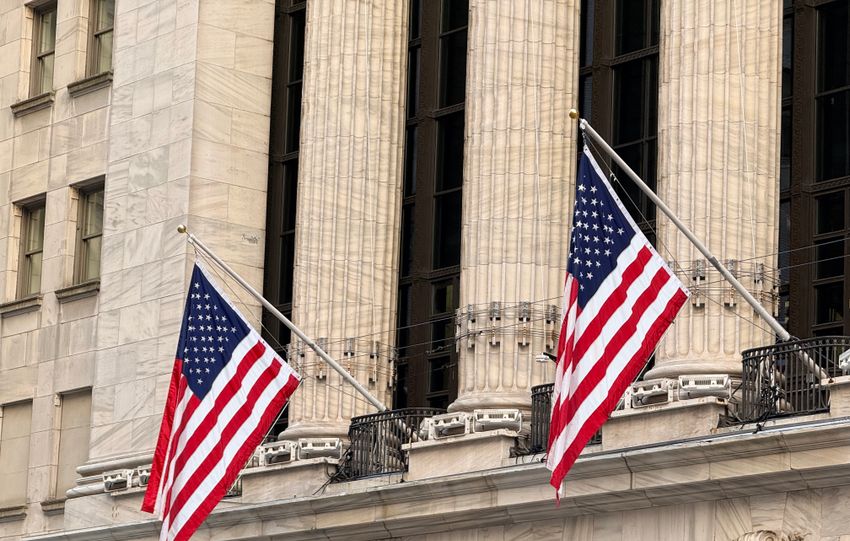
American flags displayed prominently on a historic Wall Street building in New York City.

Why Bank of America Still Sees Gold at $6,000 Despite Rate Hike Risks and Global Turmoil

Bank of America suggests gold could potentially reach $6,000, but not in the near term, due to significant headwinds from the Federal Reserve's tightening monetary policy. The bank was previously optimistic during gold's rally last year, expecting prices to hit $6,000 by spring. However, a recent correction has led its metals research team, led by…

Read more

Is Gold’s Dip a Warning or a Buying Opportunity? Unpacking the Bull Market’s Next Move

Recent news headlines have shifted as frequently as gold prices, leaving investors questioning market direction. A disconnect between record demand forecasts and sluggish price action adds to the confusion. Damian White and Joe Elkjer analyze the noise to clarify gold’s dynamics, examining whether the recent price decline is a warning or a pause in a…

Read more

A dimly lit TotalEnergies gas station at night in Nairobi, Kenya, featuring prominent signage.

Refiner Margin Squeeze and the 3:2:1 Crack Spread Signal: Technical Analysis with Focus on TotalEnergies (as of mid-June 2026)

Executive Summary The 3:2:1 crack spread serves as a primary proxy for gross refining margins, calculated as: 3:2:1 Crack Spread=2×PGasoline (bbl)+1×PDistillate/Heating Oil (bbl)−3×PCrude (bbl)3\text{3:2:1 Crack Spread} = \frac{2 \times P_{\text{Gasoline (bbl)}} + 1 \times P_{\text{Distillate/Heating Oil (bbl)}} - 3 \times P_{\text{Crude (bbl)}}}{3} where prices are typically futures-settled (e.g., WTI/RBOB/NYH HO for USGC benchmarks; Brent equivalents or regional baskets for Europe).…

Read more