Skip to content Skip to sidebar Skip to footer

Tag: Monte Carlo Simulations

Formalization, calibration, and integration of PII 1.0 into a risk framework for stablecoin transparency, per BIS June 23, 2026 alert

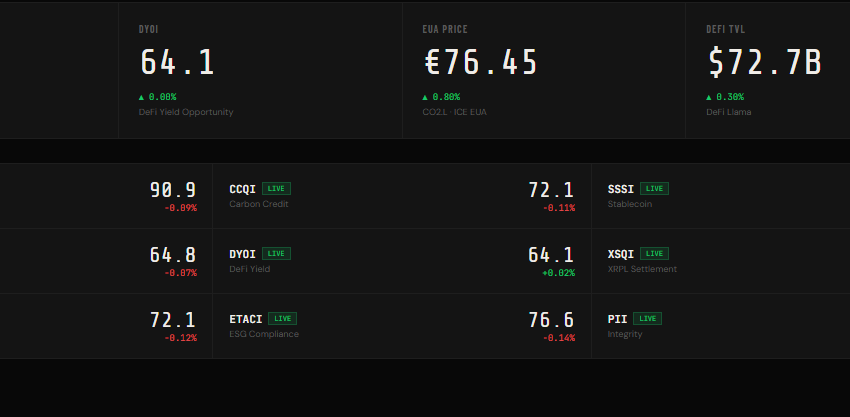
The press release from the Bank for International Settlements (BIS) acknowledges that the transparency of stablecoin ledgers exposes bank positions to the entire market, dismantling the historical information asymmetry. To quantify this phenomenon and guide investment decisions as well as technological deployment, we have constructed the Proprietary Integrity Index 1.0 (PII 1.0), a normalized composite…

Read more

Smoke billows from factory chimneys in Konin, Poland, highlighting pollution and environmental impact.

Navigating the Nuances: Synthetic Carbon Credits and Their Hidden Dangers

Synthetic carbon credit tokens provide derivative exposure to carbon markets (e.g., ICE EUA, voluntary indices) via futures, total return swaps, or oracle-replicated performance, without physical custody or retirement of underlying credits. This delivers operational efficiency (fractionalization, 24/7 liquidity, reduced verification costs) but introduces material counterparty risk (issuer solvency/fulfillment), basis/tracking error risk (deviation from reference index…

Read more

Smartphone displaying trading app with Bitcoin coins on a dark surface.

Bitcoin Struggles Near $66,000 Amidst Extreme Fear: What’s Next?

Bitcoin (BTCUSDT) trades at approximately $65,400–66,000, down ~0.8% in the observed session, within a recent consolidation range post a relief bounce from sub-$60k lows earlier in June 2026. The provided chart confirms a 1H/4H structure with MA5/10/20 clustering near $66,200–66,300, recent rejection at $67,255 highs, and downside probe the Fair Value Gap (FVG) zone around…

Read more

Black and white image of gold bars placed on scattered US dollar bills, symbolizing wealth.

Beyond the Bullion: Quantifying Gold’s Future Value in a Debt-Ridden World

The technical analysis posits a bullish outlook for gold, targeting $17,250/oz, underpinned by structural US fiscal dominance, accelerated de-dollarization, and a monetary re-evaluation of gold as an alternative reserve asset. As of June 13, 2026, US gross public debt stands at approximately $39.2 trillion, with debt held by the public at around $31.6 trillion,…

Read more

Detailed view of an industrial plumbing system featuring multiple pressure gauges and steel pipes.

Trans-Saharan Gas Pipeline (TSGP) in the Context of European Disengagement from Russian Oil/Gas and Global Oil Demand Reduction: Quantitative Strategic Assessment

The Trans-Saharan Gas Pipeline (TSGP) — a 4,128 km project linking Nigerian gas fields (Warri region) through Niger to Algeria’s Hassi R’Mel hub, with onward connection to European markets via existing Algerian infrastructure — represents a geostrategic diversification play for Europe amid categorical reduction of Russian fossil fuel dependence (oil imports down to <3-5% of…

Read more

Aerial view of illuminated night-time city highways with dynamic light trails and bustling traffic.

Transition Risks and Fuel Demand Reduction: Attribution to 15-Minute Smart Cities, Localized Smart Digitalized & Decarbonized Economies

Executive Summary Reduction in refined fuel demand (gasoline/diesel) is primarily driven by electrification (EV penetration ~25% global new sales 2025, displacing ~1.2 mb/d oil equivalent), efficiency gains (MPG improvements offsetting VMT growth), and behavioral shifts, not dominantly by 15-minute city models. The 15-minute city (proximity-based urbanism) and smart digitalized local economies contribute secondarily via…

Read more

A dimly lit TotalEnergies gas station at night in Nairobi, Kenya, featuring prominent signage.

Refiner Margin Squeeze and the 3:2:1 Crack Spread Signal: Technical Analysis with Focus on TotalEnergies (as of mid-June 2026)

Executive Summary The 3:2:1 crack spread serves as a primary proxy for gross refining margins, calculated as: 3:2:1 Crack Spread=2×PGasoline (bbl)+1×PDistillate/Heating Oil (bbl)−3×PCrude (bbl)3\text{3:2:1 Crack Spread} = \frac{2 \times P_{\text{Gasoline (bbl)}} + 1 \times P_{\text{Distillate/Heating Oil (bbl)}} - 3 \times P_{\text{Crude (bbl)}}}{3} where prices are typically futures-settled (e.g., WTI/RBOB/NYH HO for USGC benchmarks; Brent equivalents or regional baskets for Europe).…

Read more

Pillar Two’s Silent Killer: How GloBE Rules Decimate Tax Benefits for Tokenized Carbon Credits

The widespread implementation of OECD Pillar Two (GloBE rules) starting in fiscal year 2024-2025 fundamentally alters the economics of tokenized carbon credit investment. This analysis, based on quantitative modeling and international tax doctrine, demonstrates three key effects: Pillar Two erodes the tax value of tokenized carbon credits by neutralizing non-refundable tax credits and ESG incentives…

Read more

Evaluation of the Dynamics of Strategic “Backfires” and Liquidity Contagion following the “True Due Diligence” of Banks (JPM, Goldman, Barclays)

Our multi-model analysis confirms a structural break in Private Credit (PC). The increase in rates on bank credit lines (warehouse lines) and downward revaluations of collateral by institutions like JPMorgan signal the end of the positive leverage multiplier effect ("Back Leverage"). This shift forces PC funds to face margin calls and liquidity dilution. The direct…

Read more