Skip to content Skip to sidebar Skip to footer

Tag: USGC

Industrial plant with reflection in water at twilight, showing smoke stacks and lights.

Refinery Activity and Supply Chain Integrity

Executive Summary Satellite signatures combined with AIS vessel tracking and OSINT currently indicate elevated refinery activity in US/Europe amid global disruptions, but severe anomalies in Middle East tanker flows through the Strait of Hormuz. As of mid-June 2026, Hormuz transits are near-historic lows (often <10 vessels/day, down 70-97% from baseline), with widespread "dark" operations…

Read more

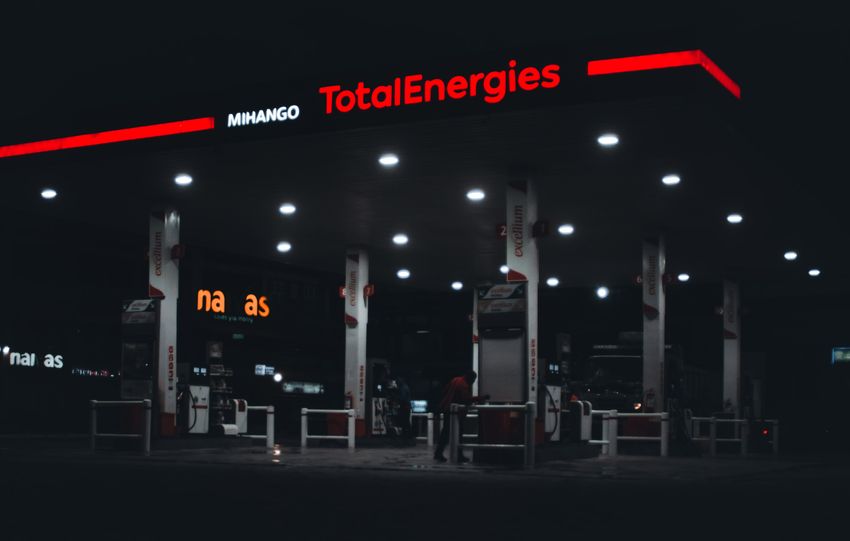
A dimly lit TotalEnergies gas station at night in Nairobi, Kenya, featuring prominent signage.

Refiner Margin Squeeze and the 3:2:1 Crack Spread Signal: Technical Analysis with Focus on TotalEnergies (as of mid-June 2026)

Executive Summary The 3:2:1 crack spread serves as a primary proxy for gross refining margins, calculated as: 3:2:1 Crack Spread=2×PGasoline (bbl)+1×PDistillate/Heating Oil (bbl)−3×PCrude (bbl)3\text{3:2:1 Crack Spread} = \frac{2 \times P_{\text{Gasoline (bbl)}} + 1 \times P_{\text{Distillate/Heating Oil (bbl)}} - 3 \times P_{\text{Crude (bbl)}}}{3} where prices are typically futures-settled (e.g., WTI/RBOB/NYH HO for USGC benchmarks; Brent equivalents or regional baskets for Europe).…

Read more