Skip to content Skip to sidebar Skip to footer

Tag: WTI

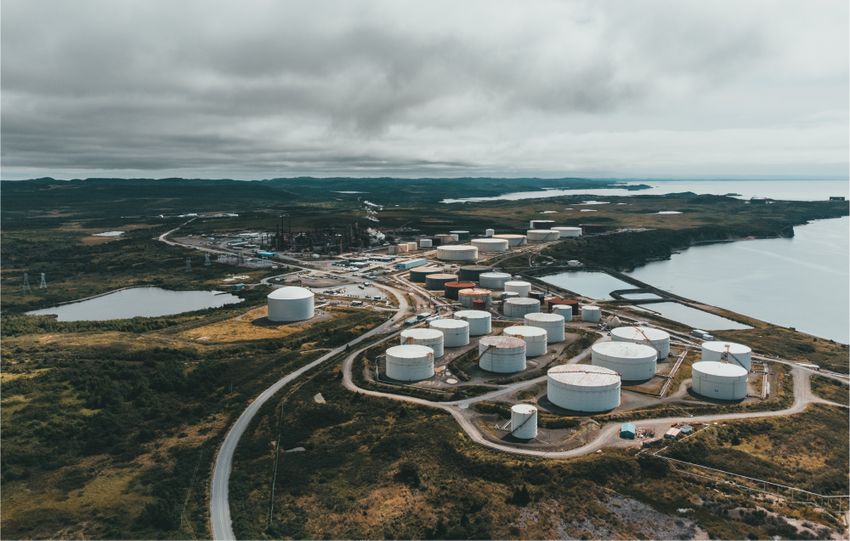
Aerial landscape shot of a coastal oil refinery with storage silos under cloudy skies.

BIS/WEF Context on Transition Risks Compressing Long-Term Refining Margins: Carbon Tracker-Style Analysis and Quantitative Projections for TotalEnergies

Executive Summary Transition risks under 2°C pathways (IEA NZE/APS equivalents) drive structural demand destruction for refined products, compressing refining margins via volume contraction, utilization drops, and policy/carbon cost overlays. Carbon Tracker’s foundational 2017 “Margin Call” analysis projected >50% EBITDA decline by 2035 for ~94% of global capacity under a 2D scenario (oil demand -23%…
Read more

SpaceX Dragon spacecraft in orbit, highlighting advanced space technology with cloud backdrop.

Liquidity Trap Scenario : Gold < $4,150, Oil ~$88 Stabilization – Integration with SpaceX IPO Retail Influx and Systemic Market Crash Risks

Executive Summary The posited Liquidity Trap manifests as a regime where elevated nominal asset prices (gold near recent highs, equities at stretched valuations) coincide with forced liquidations driven by margin calls, collateral constraints, and retail FOMO entry, without corresponding real-economy liquidity expansion. Under conditions of gold stabilizing below $4,150/oz and WTI/Brent oil around $88/bbl (current…

Read more

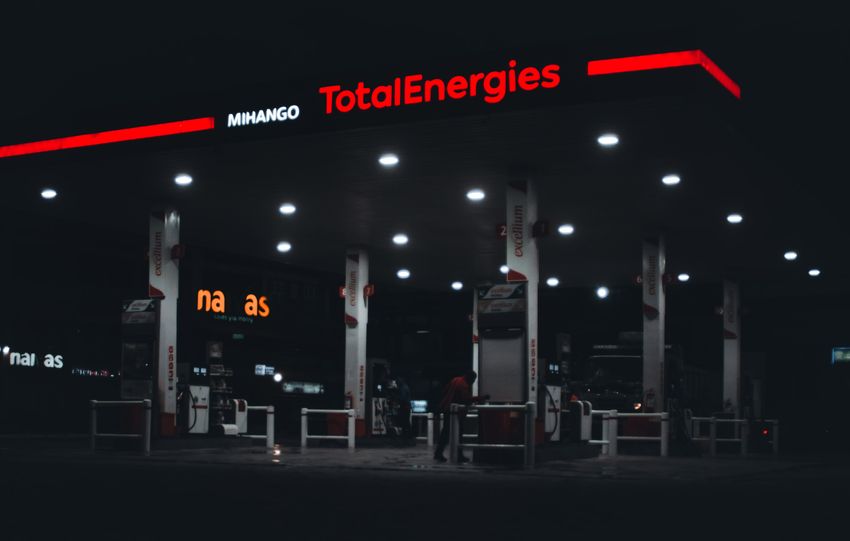
A dimly lit TotalEnergies gas station at night in Nairobi, Kenya, featuring prominent signage.

Refiner Margin Squeeze and the 3:2:1 Crack Spread Signal: Technical Analysis with Focus on TotalEnergies (as of mid-June 2026)

Executive Summary The 3:2:1 crack spread serves as a primary proxy for gross refining margins, calculated as: 3:2:1 Crack Spread=2×PGasoline (bbl)+1×PDistillate/Heating Oil (bbl)−3×PCrude (bbl)3\text{3:2:1 Crack Spread} = \frac{2 \times P_{\text{Gasoline (bbl)}} + 1 \times P_{\text{Distillate/Heating Oil (bbl)}} - 3 \times P_{\text{Crude (bbl)}}}{3} where prices are typically futures-settled (e.g., WTI/RBOB/NYH HO for USGC benchmarks; Brent equivalents or regional baskets for Europe).…

Read more

Two gold bars rest on a pile of US dollar bills, symbolizing wealth and prosperity.

Inflation Surge Crushes Gold & Silver Amidst Geopolitical Turbulence

Gold prices have plummeted, trading near $4,078.00, down 4.26%, and silver near $63.605, down 2.66%, following Wednesday's trading close. This decline is attributed to a higher-than-expected May inflation report, rising Treasury yields, and escalating US-Iran tensions, which have overshadowed demand for safe-haven assets. US consumer prices rose 0.5% in May and 4.2% year-on-year, with core…

Read more

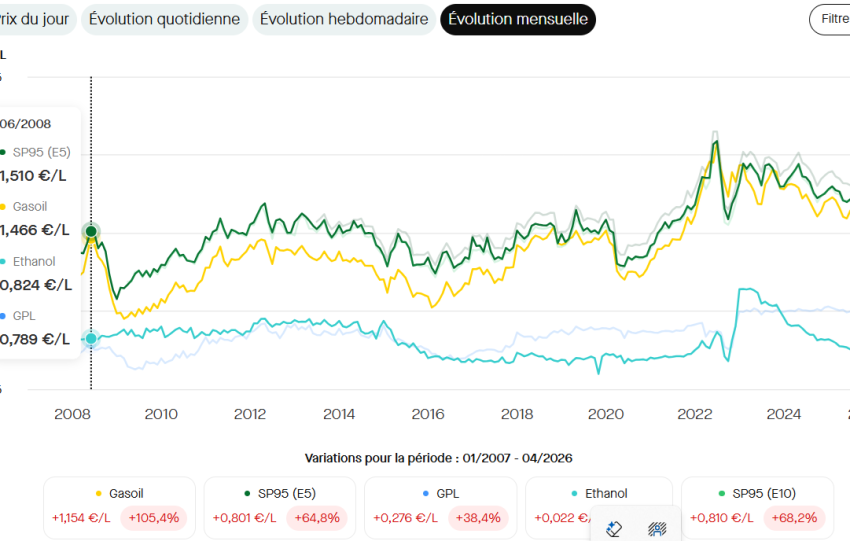
The convergence of physical, behavioral, and microstructural signals confirms that Europe, and particularly France, has entered a regime of asynchronous systemic energy shortage

The convergence of physical, behavioral, and microstructural signals confirms that Europe, and particularly France, has entered a regime of asynchronous systemic energy shortage. The three pillars of the breakdown: (a) Physical Pillar. The Strait of Hormuz has been practically blocked since February 28, 2026: more than 20% of global oil traffic and 25% of…

Read more

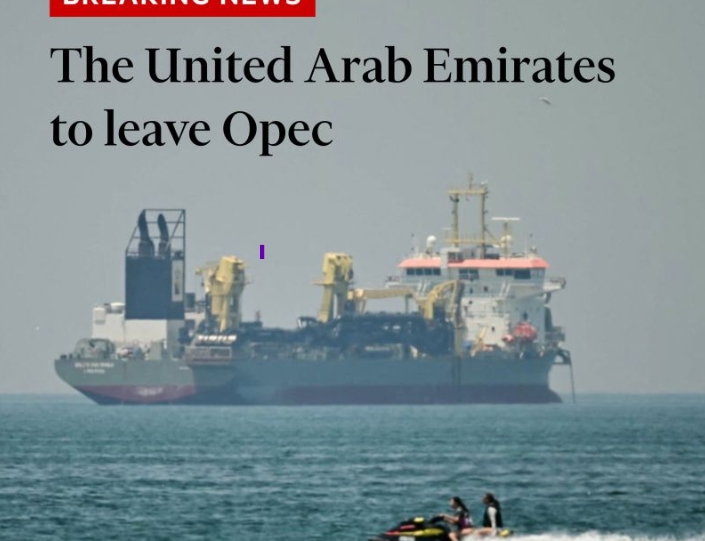
Cartel collapse and depressive supply shock. The withdrawal of Saudi Arabia and the UAE of OPEC/OPEC+

The simultaneous withdrawal declaration of Saudi Arabia and the United Arab Emirates from OPEC and OPEC+ (April 28-29, 2026) constitutes the most severe institutional rupture in the oil market since 1985-1986. This study demonstrates that this exit is not a purely bearish signal but rather the prelude to a two-speed structural dislocation: …

Read more

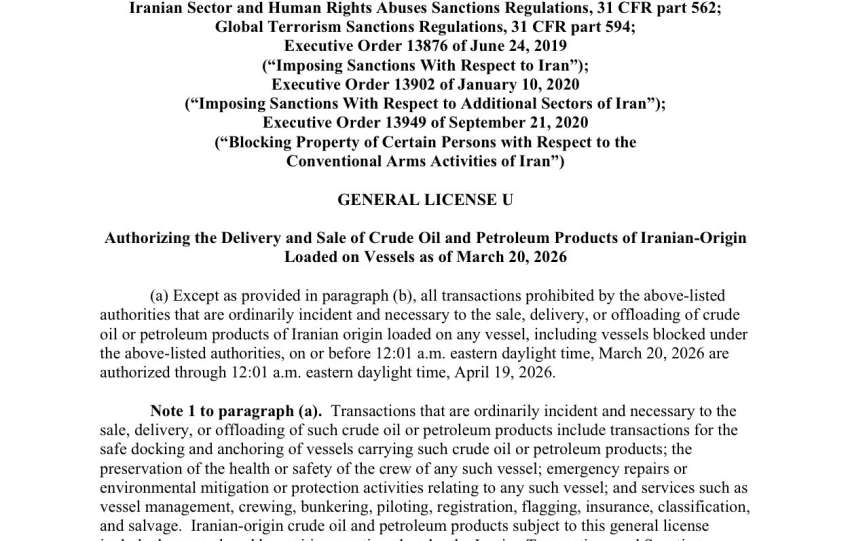
The U.S. Treasury temporarily lifts nearly all sanctions on Iranian oil tankers, allowing exports loaded March 20 – April 19, 2026, signaling a major shift in Iran policy

The U.S. Treasury's General License U (issued March 20, 2026) is explicitly designed to exert downward pressure on oil prices by flooding the market with additional supply at a time when prices have surged over 50% since the U.S.-Israeli conflict with Iran began in late February. Why It Targets Prices The license authorizes the…

Read more

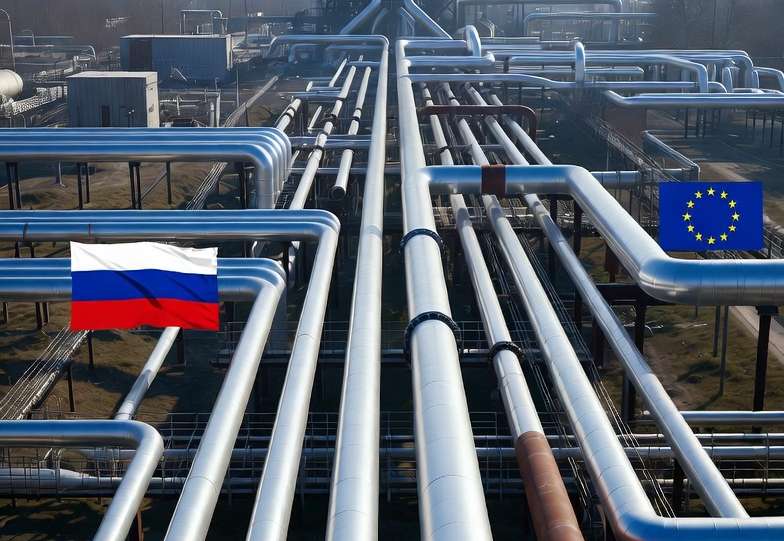
Return of Russian oil. Systemic inversion of hydrocarbon flows (Russia–EU). Collapse of the risk premium and gravitation of liquidity clusters.

Europe has hit a mathematical wall: the blockage of the Strait of Hormuz has removed 5 to 7 million barrels per day (b/d) from the market. Replacement by American Liquefied Natural Gas (LNG) cannot cover this deficit due to the physical limits of regasification capacities. Under these conditions, the return of Russian oil and gas…

Read more

Le plus violent mouvement spéculatif depuis au moins 40 ans : les marchés de l’or et de l’argent

Voici un condensé de l'écrit de Thomas Andrieu, "Recul historique de l’or et de l’argent dans un contexte d’incertitudes boursières" paru le 3 février 2026. Le vendredi 30 janvier 2026 restera une date mémorable pour les marchés de l'or et de l'argent, marquant la plus forte variation journalière depuis au moins les années 1980 et…

Read more