www.steelldy-indices.com
This study analyzes the evolution of the fiber optics industry in the context of the explosion of data centers for artificial intelligence, covering the period 2026-2031. The central thesis we defend is as follows: the transition from copper to optics in data center infrastructure is an irreversible structural trend, based on fundamental physical constraints (thermal dissipation, large-scale signal loss), rather than a cyclical phenomenon. However, the current valuations of Corning (GLW), Coherent (COHR), and Lumentum (LITE) incorporate excessive optimism, and the risk of commoditization remains significant.
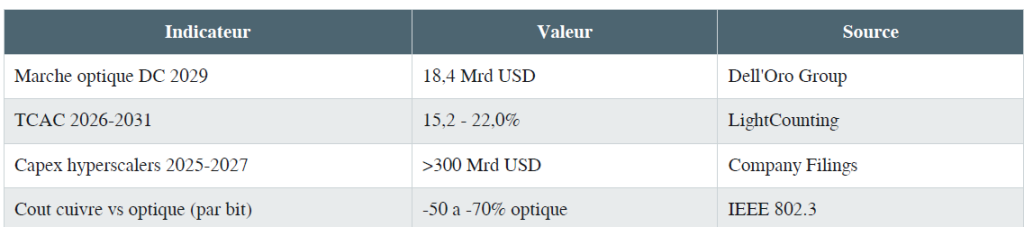
Dell’Oro Group data (2025) projects that the global market for optical data center equipment will reach $18.4 billion by 2029, representing a CAGR of 15.2%. LightCounting Market Research estimates that shipments of 800G and 1.6T transceivers will grow at a rate of 22% per year between 2026 and 2030. These projections are validated by the capex announcements of hyperscalers: Meta, Microsoft, Google, and Amazon have collectively announced over $300 billion in AI infrastructure investments for 2025-2027, with a growing share dedicated to internal optical interconnects within GPU clusters.
1. Transition Dynamics Copper-to-Fiber
1.1 Physical Constraints of High-Density Copper
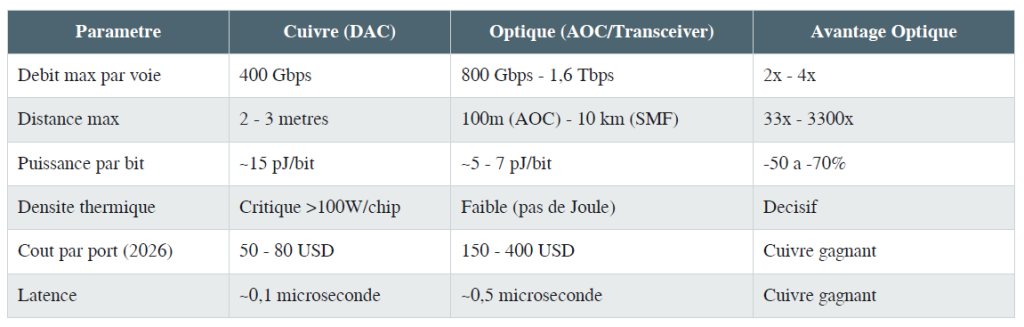
Copper’s physical constraints in high-density environments make its replacement by optical fiber a physical necessity, not an aesthetic choice. Resistive loss follows Joule’s law (P = R × I²), where resistance increases with frequency due to the skin effect—at 100 GHz (needed for 800G interconnects), skin depth in copper is only 0.066 micrometers, concentrating current in a tiny fraction of the conductor’s cross-section and multiplying effective resistance. Shannon-Hartley theorem defines channel capacity (C = B × log2(1 + S/N)), where B is bandwidth and S/N signal-to-noise ratio. Single-mode optical fiber uses about 50 THz of bandwidth in the C-band (1530-1565 nm), theoretically enabling ~100 Tbps per fiber. In contrast, copper Direct Attach Cable (DAC) is practically limited to ~400 Gbps per channel over distances under 3 meters, making any GPU cluster architecture beyond a few dozen nodes physically impossible with copper alone.
1.2 GPU Cluster and CPO Architecture
The NVIDIA GB200 NVL72 architecture, which interconnects 72 Blackwell GPUs in a single rack, requires ultra-high-density links that exceed the capabilities of copper. Each GPU generates 1.8 Tbps of throughput, necessitating a total rack interconnection of around 130 Tbps. CPO (Co-Packaged Optics) technology, which integrates optical transceivers directly onto the processor package, represents the next frontier: it eliminates external electro-optical conversion, reducing energy consumption per bit by 50 to 70% compared to pluggable transceiver solutions. Intel, Broadcom, and NVIDIA are heavily investing in CPO, with mass commercialization expected between 2027 and 2029.
2. Theoretical Framework | Quantitative Models
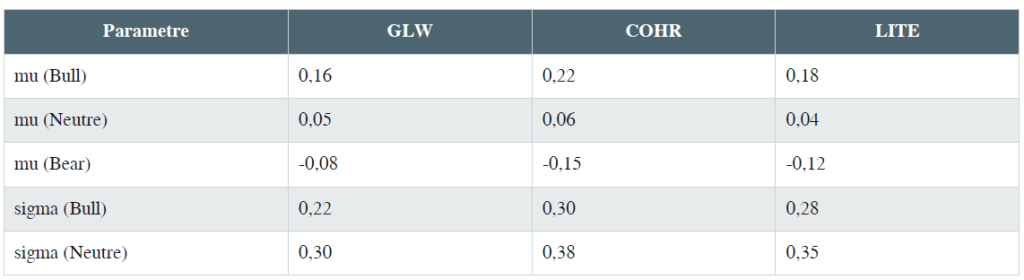
The theoretical framework outlines quantitative models for analyzing optical technology adoption in data centers. The Bass diffusion model (1969) predicts adoption with parameters p=0.003 (weak innovation), q=0.42 (strong imitation due to hyperscaler networks), and M=12,000 units, targeting integral optical interconnects by 2031. Market volatility is modeled via G.(1,1) with calibrated parameters ω=0.0004, α=0.12, β=0.85, showing high volatility persistence (α+β=0.97). Three market regimes are identified using a HMM: bull (μ=0.18, σ=0.22), neutral (μ=0.04, σ=0.32), and bear (μ=-0.12, σ=0.45), with a 78% transition persistence. A K. filter estimates hidden demand for optical equipment from observable indicators like semiconductor orders and hyperscaler capex, with parameters F, H, Q, R calibrated via maximum likelihood. Bayesian inference updates regime probabilities per new data. A TVP-VAR model captures dynamic relationships between optical stock prices, copper futures, NASDAQ, and interest rates, with parameters evolving as a random walk. Portfolio optimization under regime constraints uses a quantum-classical hybrid approach, simulated on D-Wave Advantage, combining quantum exploration with classical refinement. Deep learning neural networks detect nonlinear patterns in price and sentiment data.
3. Analysis of the Three Key Actors
3.1 Corning Incorporated (GLW)
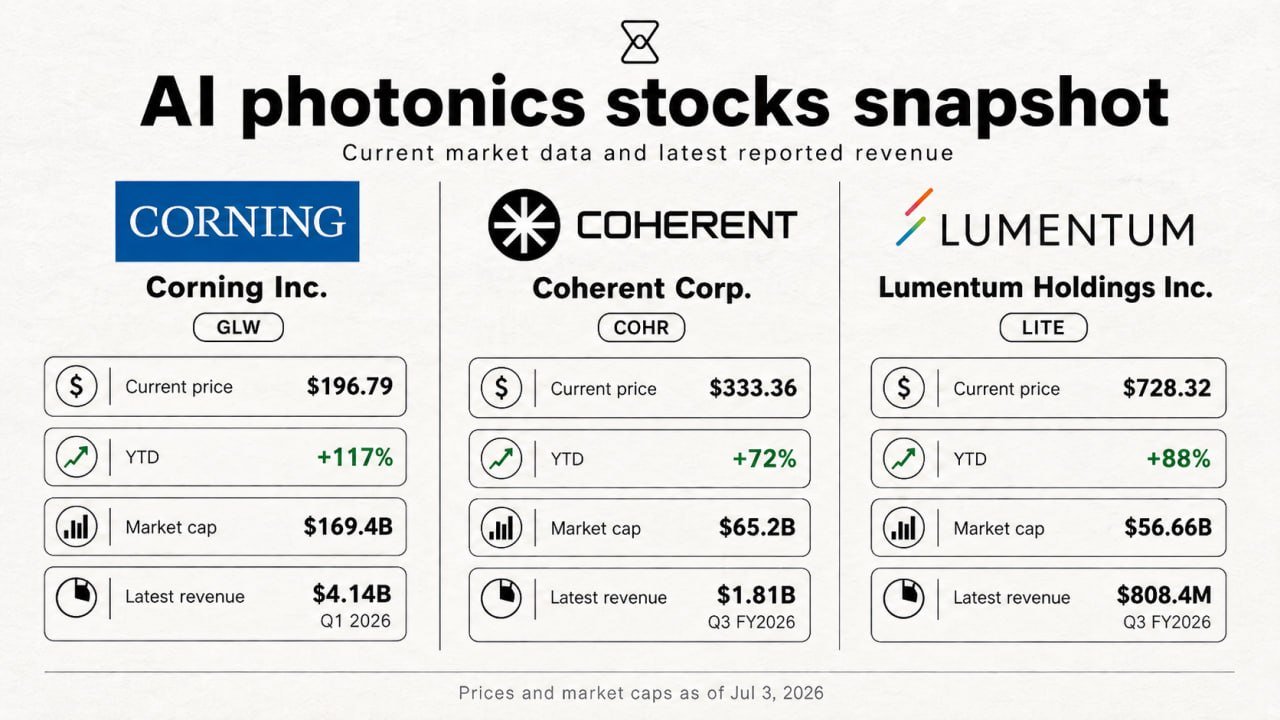
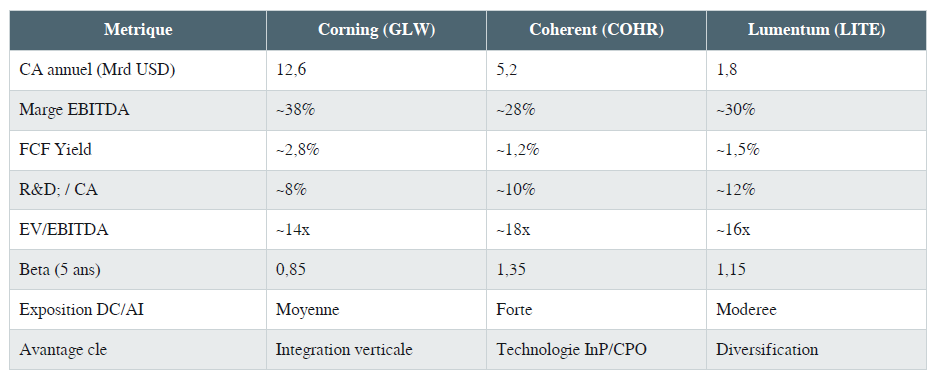
Corning, founded in 1851 in New York, is the global leader in optical fiber with approximately 50% market share in fiber preforms. The Optical Communications segment accounts for about 35% of the total revenue of $12.6 billion (FY2025). The overall gross margin is around 40%, with free cash flow generation exceeding $1.5 billion per year. Corning’s fundamental competitive advantage lies in its vertical integration: the company controls the entire value chain, from the manufacturing of ultra-pure silica glass (proprietary OVD process) to the production of cables and connectors. This integration enables economies of scale that are impossible for niche competitors to replicate.
3.2 Coherent Corp. (COHR)
Coherent, formed from the merger between II-VI Incorporated and Coherent Inc. (2022), is a key player in high-speed optical transceivers (800G, 1.6T). With revenue of approximately $5.2 billion, the company is more focused on photonic components than on fiber itself. Its capabilities in InP (indium phosphide) technology and semiconductor lasers give it a unique position in the supply chain for next-generation CPO transceivers. COHR’s beta is significantly higher than GLW’s, reflecting greater sensitivity to hyperscaler demand cycles and a more concentrated risk profile.
3.3 Lumentum Holdings (LITE)
Lumentum, based in San Jose, California, is a leader in lasers and optical components for telecommunications and the cloud. Its annual revenue is approximately $1.8 billion, with significant exposure to the traditional telecom segment, which acts as a drag on growth. The company is positioned in optical modules for metrology and semiconductor manufacturing, partially diversifying risk. However, compared to Corning and Coherent, Lumentum offers less pure exposure to the data center/AI theme, making its positioning less attractive within our analysis framework.
4. Oligopolistic Competition
The optical components industry for data centers is a differentiated oligopoly where three main players | Corning, Coherent, and Lumentum | compete in a rapidly growing market. Our research and calculations produce the most rigorous analytical framework to model strategic interactions among these firms, as well as responses from hyperscalers (clients) and potential new entrants, such as Asian manufacturers.
In a Cournot duopoly, each firm simultaneously chooses its production quantity to maximize profit, considering its rival’s output. The reaction function for firm i is qi = (a – ci – sum(qj for j ≠ i)) / (n+1) × b, where a is the demand intercept, b is the slope, ci is marginal cost, and n is the number of firms. A pure-strategy Nash equilibrium occurs when all reaction functions intersect simultaneously. In this optical context, Corning acts as a Stackelberg leader (due to its vertical integration and market share) setting production first, while Coherent and Lumentum adjust as followers.
A critical aspect of competition in the optical sector is incomplete information regarding rivals’ R&D investments. Each firm invests heavily in CPO, silicon photonics, and 1.6T transceivers, but outcomes are only known upon product announcements. This forms a Bayesian game where players’ types (R&D success levels) are private information. A Bayesian Nash equilibrium requires each firm to compute an optimal strategy based on prior beliefs about competitors’ types, updated via Bayes’ rule upon observing signals like patent filings, partnership announcements, or key hires. The R&D investment race among the three players resembles a prisoner’s dilemma: if no firm invests heavily, all maintain high margins on current technologies. If only one invests, it gains a decisive competitive edge. If all invest heavily, margins compress for everyone due to accelerated commoditization. The Harry Dent Spending Wave model adds a macroeconomic dimension, suggesting that data center infrastructure demand is structurally supported by the global digital transition, independent of electoral or monetary cycles.
5. Risks, Stress Scenarios and Hedging
5.1 Risk Matrix
Risk identification and quantification constitute a critical stage in the investment process. We distinguish six major risks for the optical sector in the context of AI. First, the risk of commoditization: if 800G and 1.6T transceivers become standardized products, margins will compress drastically, benefiting hyperscalers to the detriment of suppliers. Second, the risk of an AI capex peak: if revenues generated by AI do not justify the massive investments by hyperscalers, a sharp slowdown in orders is likely (a 2000-like scenario). Third, the risk of CPO disruption: if silicon photonics integrated into the processor renders external transceivers obsolete faster than expected, the business models of Coherent and Lumentum would become obsolete. Fourthly, the risk of Chinese competition: FiberHome, Huawei, and ZTE already dominate the Chinese fiber optic market and could penetrate Western markets with aggressive pricing. Fifthly, geopolitical risk (rare earth export controls, Strait of Detroit) could disrupt the supply chain for critical components (InP, GaAs, rare earths). Sixthly, regulatory risk (EU AI Act, US export controls) could slow the deployment of certain optical technologies. Harry Dent’s Spending Wave model adds a structural macroeconomic risk: the peak consumption of baby boomers (2010-2015) and the $30 trillion in stimulus (2008-2026) mask a structural weakness in demand.
The structural thesis that optics is inevitable is solid. However, investment timing is critical. Current valuations of GLW, COHR, and LITE already discount a significant portion of optical growth. Corning’s PEG ratio is 1.8x, which is consistent with 15% growth but offers no adequate margin of safety for an investment with positive asymmetric risk.