Analyse de marché
Executive Summary
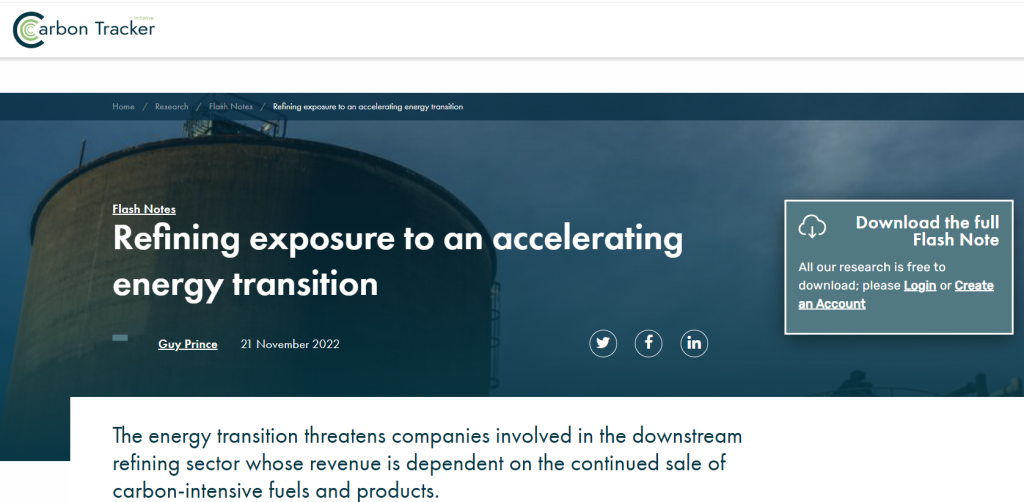
Transition risks under 2°C pathways (IEA NZE/APS equivalents) drive structural demand destruction for refined products, compressing refining margins via volume contraction, utilization drops, and policy/carbon cost overlays. Carbon Tracker’s foundational 2017 “Margin Call” analysis projected >50% EBITDA decline by 2035 for ~94% of global capacity under a 2D scenario (oil demand -23% cumulative, rationalization of ~25% capacity). Updated 2022 exposure notes reinforce asset stranding potential amid accelerating EV adoption and policy tightening.
For TotalEnergies, integrated exposure (refining ~ portion of downstream) faces partial hedge via Upstream/LNG/Power pivot, but European assets remain vulnerable (higher carbon intensity, ETS/CBAM). Steelldy Risk Engine-style Markov-switching regime models and factor decomposition flag elevated tail risks in accelerated transition states (probability-weighted impairment uplift 10-20%+ in $200/tCO₂ sensitivity).
Core Thesis : Short-term crack spread volatility (geopolitics, utilization) masks long-term compression. BIS financial stability lens highlights NBFI/collateral transmission; WEF Davos emphasizes uneven transition with financing gaps. Real-options valuation and stochastic simulation project material NAV drag absent high-grading and diversification.
1. Mathematical and Scenario Framework
This framework (request our full study by email) analyzes demand destruction pathways in oil, aligning with IEA, OPEC, and Carbon Tracker scenarios. A 2°C/NZE scenario projects oil demand peaking early and declining 1-2% annually post-2030, primarily in transport. Refining throughput would contract, leading to utilization rates below 70% in OECD/Europe without closures. The EBITDA Impact Model suggests a 50%+ EBITDA drop from volume reduction (20-30%), margin compression, and rising operational/carbon costs, with carbon costs adding $0.5-3/bbl. The Steelldy Risk Engine, using Factor Decomposition and Markov-Switching, identifies regimes like Normal, Transition Stress, and Geopolitical Overlay. Transition VaR assesses portfolio loss under accelerated decarbonization. Stress tests incorporate a $100-200/t internal shadow carbon price, leading to NPV impairments. Real Options Analysis values refinery flexibility as compound American options, with the value of waiting increasing in high-transition regimes. GARCH and Kalman Filters model refining margin volatility, incorporating carbon shocks and using noisy signals like policy sentiment and liquidity indicators to update transition intensity.
2. BIS / WEF / Macro-Policy Overlay (Financial Stability Lens)
The BIS highlights vulnerabilities in commodity financing exacerbated by the energy transition, citing NBFI leverage and margin spirals. It warns of mispriced climate risks in financial institutions’ portfolios and potential collateral traps if demand for certain products declines rapidly. Cross-border claims and USD funding shortfalls increase transmission risks for refining-reliant emerging markets.
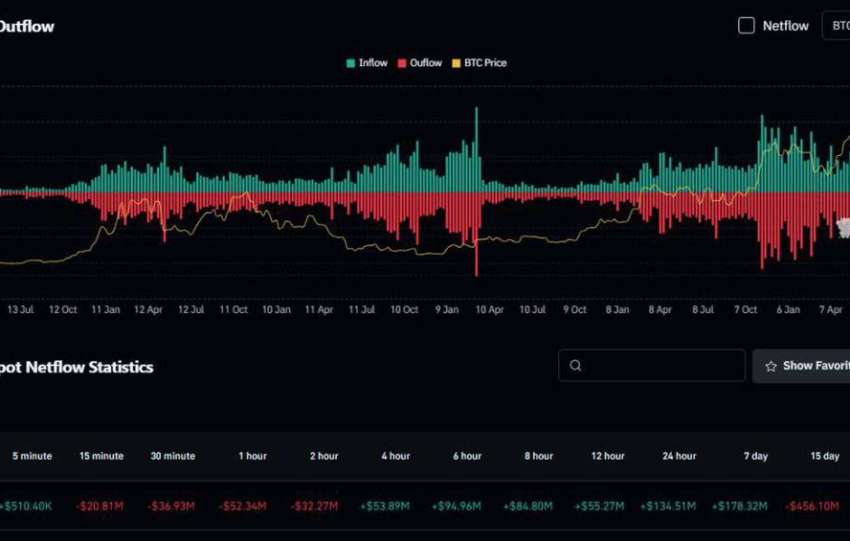
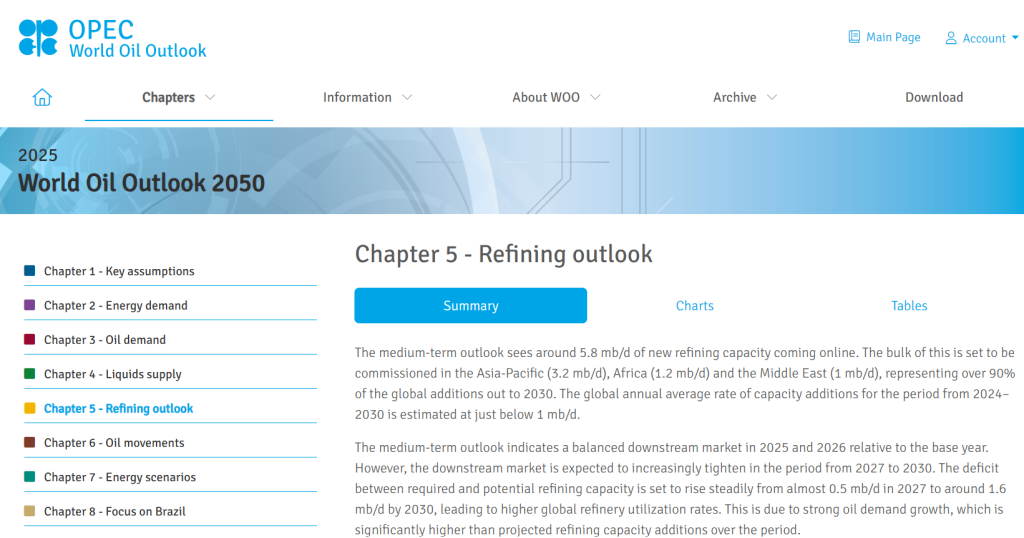
The WEF’s Global Risks Report 2026 identifies environmental risks as dominant over the next decade, including extreme weather and biodiversity loss. However, short-term geoeconomic confrontation and financing gaps impede an orderly transition. Despite record clean energy investments ($2.3 trillion in 2025), emissions are at highs, and supply chain fragmentation is increasing costs for low-carbon technologies. Policy transmission mechanisms are at play, with the EU ETS Phase 4 and CBAM leading to declining free allocations and increased carbon costs for marginal refiners, estimated at $0.5-2+ per barrel. Divergence between IEA and OPEC outlooks on future oil demand is noted; the IEA predicts a sharper drop, while OPEC anticipates higher utilization. Required capacity additions are concentrated in Asia and the Middle East, suggesting rationalization in OECD and European markets. « Smart money » indicators suggest CTAs may liquidate long positions if margin compression persists. Institutional investors are accumulating stakes in integrated major oil companies through dark pools and ATS, with high-frequency trading firms seeking liquidity in resilient entities. Prediction markets like Polymarket and Kalshi are being used to track transition milestones, such as EV mandates and ceasefires impacting oil markets.
3. TotalEnergies-Specific Quantification (2026 Disclosures)
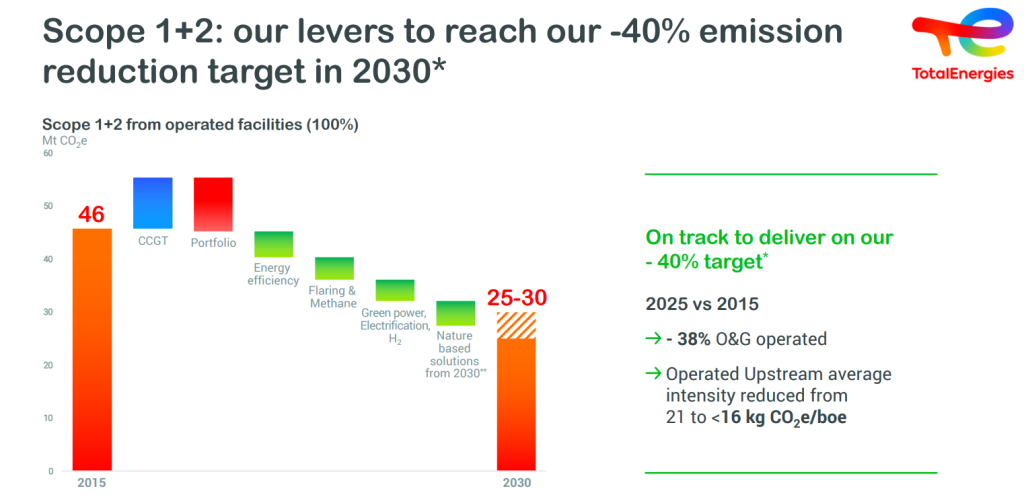
TotalEnergies employs an Internal Carbon Price (ICP) of $100/t base from 2023, increasing by 2% annually post-2030, with a $200/t sensitivity potentially impacting asset NPV by ~15%. The company is on track for Scope 1+2 reductions (33.1 Mt in 2025) and has decreased lifecycle intensity by 18.6% since 2015. Refining exposure is managed through petrochemical integration and power growth ($3-4B/yr). However, Scope 3 emissions (91% of total) present a challenge, with current targets allowing for potential near-term growth. Impairment and Net Asset Value (NAV) risks are present, particularly for European assets, which show negative margins in bear scenarios due to replacement cost accounting. While cash flow is resilient at $70+/b Brent, the long-term refining contribution is discounted due to an elevated WACC, reflecting a transition beta premium of 1.5-2.0. Monte Carlo simulations (10,000 paths) incorporating variables like oil demand, utilization, EUA prices, and crack spreads project different outcomes.
A base scenario (STEPS-like) indicates moderate compression and mid-cycle refining margins of $7-12/bbl. A 2°C accelerated scenario suggests a 40-60%+ refining EBITDA drag by 2035 and 15-30% capacity closures, shifting portfolio weight towards Integrated Power/LNG for higher risk-adjusted returns. In a tail scenario, demand destruction exceeding consensus could lead to impairments and tax loss harvesting opportunities. Behavioral and sentiment analysis using the OCEAN model and NLP identifies potential investor capitulation on « oil panic » narratives and flags provisioning gaps in audits. Demographic trends (post-boomer spending wave) are expected to pressure long-term liquid fuels demand. Satellite monitoring (Planet Labs) and AIS data are used for real-time refinery throughput validation and to detect marginal supply pressure from illicit trade.