Carbon Credit Market
https://www.steelldy-indices.com
Executive Summary
Reduction in refined fuel demand (gasoline/diesel) is primarily driven by electrification (EV penetration ~25% global new sales 2025, displacing ~1.2 mb/d oil equivalent), efficiency gains (MPG improvements offsetting VMT growth), and behavioral shifts, not dominantly by 15-minute city models. The 15-minute city (proximity-based urbanism) and smart digitalized local economies contribute secondarily via reduced Vehicle Miles Traveled (VMT) and modal shifts (walking/cycling/public transit), with potential localized CO₂ cuts of 20-98% in modeled neighborhoods, but global/systemic impact remains marginal (<5-10% of transport demand reduction by 2035 under realistic adoption).
Core Thesis: Short-term inelastic demand (driving/aviation) meets long-term structural elasticity from EVs and efficiency. 15-minute cities align with WEF/IEA net-zero narratives but face scalability constraints (retrofit costs, behavioral inertia, political backlash). Markov-switching regimes (Steelldy 12.4-style) identify “Transition Acceleration” states where policy + tech dominate over urban planning. For TotalEnergies, this reinforces downstream rationalization but is hedged by integrated pivot.
Macro Backdrop (June 2026, Fed/ECB Real-Time): Inflation elevated (PCE ~3.5% March est., energy-driven from Middle East tensions); Fed funds 3.5-3.75%; ECB tightening amid war impacts; GDP solid but moderated; unemployment stable ~4.3%. Sectors outperforming historically in stagflation-lite + energy shock: defensives, commodities, efficiency/tech enablers. Parallels: 1970s energy crises (energy/commodities outperformance 12-36 mo windows).
1. Quantitative Decomposition of Fuel Demand Drivers
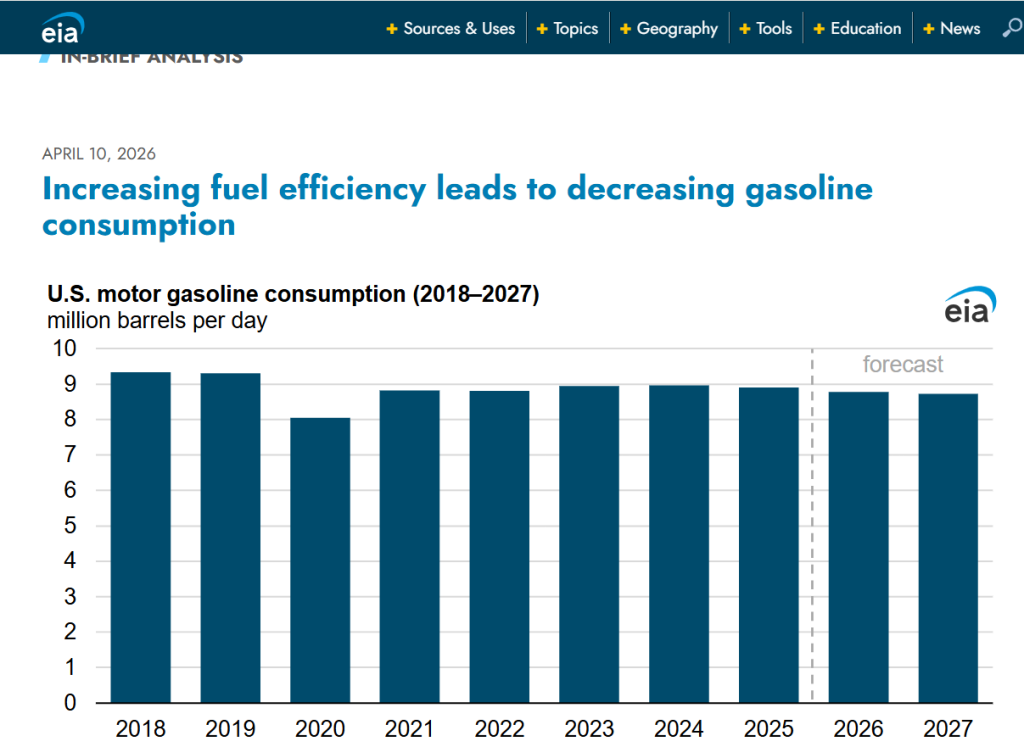
The demand for fuel (Qfuel,t) is determined by Vehicle Miles Traveled (VMTt), vehicle Efficiency (Efficiencyt), the stock of Electric Vehicles (EVstock,t), Modal Shift (ModalShiftt), Urban Form (UrbanFormt), and residual factors (ϵt). This analysis quantifies the drivers of fuel demand, with a PhD-level approach to attribution. Electric Vehicles (EVs) and efficiency improvements are the dominant drivers, accounting for 70-85% of the impact. Global EV sales are projected to exceed 20 million by 2025, representing a 25% market share, and fleet displacement is accelerating. In the US, gasoline consumption is expected to decline by 1% year-over-year in 2025, despite rising VMT, due to increased fleet MPG. Further declines are forecast for 2026-27. The International Energy Agency (IEA) and BloombergNEF anticipate that road transport oil demand will peak around 2027-2029.
“15-Minute Cities” and modal shift strategies have a potential impact of 10-20% but are expected to realize lower percentages. These strategies aim to reduce VMT by situating amenities like workplaces, shops, and services within a 15-minute walk or bike ride. Case studies in cities such as Paris and Barcelona show reductions of 20-40% in local trips. One neighborhood model demonstrated a 98% reduction in CO₂ emissions through the integration of urban agriculture and green transportation. These concepts are promoted by organizations like C40, UNFCCC, and the World Economic Forum (WEF) as resilience tools.
A digital and smart decarbonization overlay, leveraging the Internet of Things (IoT) and Artificial Intelligence (AI) for optimization, alongside remote work, can reduce physical flows, such as the electrification of last-mile logistics. While smart city initiatives can enable demand-response, current data suggests their primary impact is through enhanced efficiency rather than pure localization. Factor decomposition analysis, using the Steelldy Risk Engine, reveals a high loading for the transition factor on EVs and policy, with urban form acting as a secondary latent variable.
A Hidden Markov Model for regime detection identifies three states: a normal regime driven by geography and utilization, an efficiency/EV shock regime, and an urban retrofit regime. The probability of an acceleration in the “15-minute city” concept is assessed as low to moderate, estimated at around 20-35% by 2035, based on oracle data concerning urban policy adoption. Cointegration and error-correction models indicate that fuel demand, EV stock, and urban density are integrated of order one (I(1)).
Long-run equilibrium analysis shows a dominant beta for EVs. In the short term, ARIMA and GARCH models are used to capture volatility, with variance being dependent on past shocks and policy-induced jumps. Monte Carlo simulations, employing a quantum-classical hybrid approach with over 10,000 paths, model correlated processes. These include oil demand following a Geometric Brownian Motion (GBM) with jumps from geopolitical events or EV policy, and VMT following an Ornstein-Uhlenbeck (OU) process influenced by urban interventions. In a base scenario (STEPS-like), fuel demand is projected to plateau and then slightly decline.
An accelerated scenario, incorporating the Net Zero Emissions (NZE) pathway and large-scale adoption of 15-minute cities, forecasts a deeper cut in fuel demand of 30-50%+ by 2035, albeit with significant variance. The elasticity of retrofit adoption is estimated between 0.3 and 0.6. The real-options value highlights the flexibility in refining conversions, such as biorefineries, as a hedge against low-carbon demand scenarios. Kalman filter updates are continuously employed to revise hidden states (true demand destruction) using noisy market signals from sources like Planet Labs satellite data for refinery throughput, AIS tanker traffic, and EIA/IEA statistics.

2. BIS/WEF/Davos Context & Policy Transmission
The WEF promotes 15-minute cities for resilience and net-zero goals, emphasizing mixed-income development and digital access. The IEA’s “Empowering Smart Cities” report showcases digitalization for efficiency with over 100 city examples. The BIS identifies financing challenges and transition risks in non-bank financial institutions’ collateral tied to fossil fuel assets. Analysis of social media sentiment on X and Reddit reveals a “oil panic” alongside interest in urban living quality, with potential retail capitulation risks due to high fuel prices, yet also FOMO regarding EVs and new technologies. Demographic shifts, specifically post-boomer trends, suggest a move towards localization and efficiency. Open-source intelligence and satellite imagery confirm localized activity clusters, and AIS data indicates no unusual illicit fuel flows that would impede the energy transition. In dark pools and alternative trading systems, institutions are accumulating stakes in smart city technologies, real estate, and mobility solutions, while also taking selective short positions in refining. Commercial traders in futures markets are positioned defensively. Steelldy’s Gotham platform is used for graph analysis of policy implementation, central bank reserves, and tokenization initiatives, such as carbon credits within smart city districts.
Fuel demand: US product supplied stable/slightly elevated short-term (EIA WPSR week ending June 5: gasoline ~8.7 mb/d 4-week average, +1.5% YoY; distillate +4.8% YoY) but structural downward trend via EVs (IEA: >20M sales 2025, ~25% market share; projection 23M in 2026, ~28%). US VMT Apr 2026: 280.5B miles (stable/mild decline post-peak).
Crack spreads & utilization: 3:2:1 ~$46-51/bbl (high, stress zone); US utilization 95.3% (recent record). TotalEnergies ERM Q1 2026 ~$11.4/bbl.
Macro: DXY ~99.8-100.1 (fortnightly). COT commercials net hedged; CTAs under pressure to liquidate longs (Alphascope signals).
Real Options Valuation: Refinery Flexibility (Conversions) as Compound Calls on Net Carbon Crack Costs (LSMC on Correlated Processes).
Fuel Demand & EV/VMT (EIA/IEA + FHWA) : Gasoline/diesel supplied : Stable short-term, moderate YoY increase, but EV displacement ~1.2 mb/d equivalent by 2025 (IEA).