Carbon Credit Market
1. Carbon Pricing Framework: Explicit (EU ETS) vs. Implicit/Internal Shadow Pricing
TotalEnergies employs an internal carbon price (ICP)1 or shadow price in its project evaluations and asset impairment testing. Currently, its base case includes a minimum price of $100/tCO₂ (or higher jurisdictional prices) starting in 2023, with a 2% annual increase after 2030.
Sensitivity analyses explore a $200/tCO₂ scenario, revealing an approximate 15% negative impact on the discounted present value of all assets, compared to earlier estimates of 9%. This impact highlights residual exposure in European refining, despite some hedging through integration. European refineries operate under the EU Emissions Trading System (ETS) Phase 4, receiving free allowances based on benchmark efficiency. However, the Carbon Border Adjustment Mechanism (CBAM), phasing in from 2026, will gradually reduce these free allowances, increasing exposure to full auction prices.
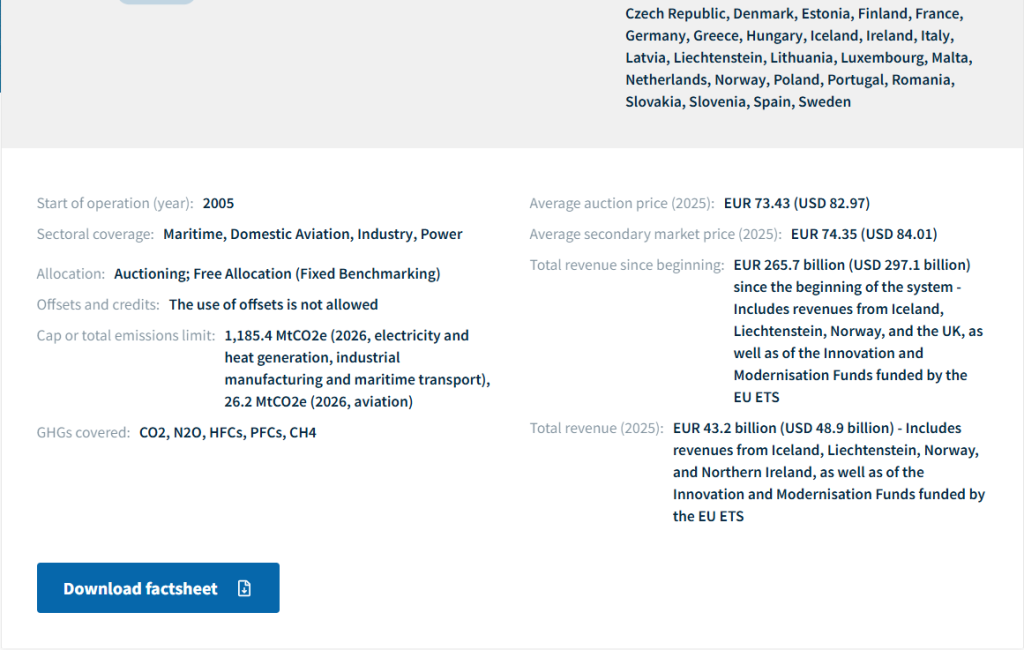
The average 2025 EU Allowance (EUA) price is around €73-74/t, with futures suggesting a modest near-term rise. The per-barrel carbon cost for European refining is estimated at $0.5-$2+, varying with intensity, utilization, and free allocation. This cost can negate net margins during periods of low refining margins. TotalEnergies prioritizes projects based on marginal abatement cost (MAC) curves, comparing its internal shadow price to the costs of abatement technologies like low-carbon hydrogen and Carbon Capture and Storage (CCS).
European refineries aim to source over 200 kt/y of low-carbon hydrogen, requiring premiums to bridge the cost gap with conventional hydrogen. For quantitative modeling, Real Options Analysis (ROA) is used to value refinery flexibility, treating it as an American option on crack spreads after accounting for carbon costs.
Stochastic dynamic programming and Least-Squares Monte Carlo methods are applied to correlated price processes, including crude, products, and EUA prices. EUA prices exhibit mean-reversion and policy-driven jumps, linked to refining margins via error-correction models. Value at Risk (VaR) calculations incorporate $100-$200/t carbon price shocks and demand elasticity. An ESG and transition risk overlay, inspired by WEF and BIS perspectives, uses shadow pricing to assess Paris Agreement alignment (well-below 2°C). Simple European assets face higher stranded asset risk, while complex or integrated sites with petrochemical co-location demonstrate greater resilience due to higher capture rates and byproduct valorization.
2. Tax Loss Harvesting and Fiscal Optimization in Down Cycles
Refining companies, characterized by high fixed costs and volatile margins, can strategically utilize losses incurred during downturns to generate tax benefits. These losses can create Net Operating Losses (NOLs) or current-year offsets against profits in other group entities, effectively reducing the overall tax burden. TotalEnergies‘ French operations, for instance, recorded a substantial loss in early 2025 due to refining weakness, resulting in zero French corporate income tax despite global profitability, though the company still contributed through share buyback taxes.
The global effective tax rate for such integrated companies can be higher than statutory rates due to upstream jurisdictions. A quantitative framework for understanding tax optimization involves decomposing the Effective Tax Rate (ETR) into current and deferred tax components relative to pre-tax accounting income.
Employing Replacement Cost (RC) accounting, instead of FIFO, can smooth inventory effects and reduce earnings volatility, which is beneficial for fiscal planning. NOLs, which can be carried forward indefinitely in certain jurisdictions like France with restrictions, are recognized as deferred tax assets (DTAs) on the balance sheet, subject to realizability tests. In integrated groups, these NOLs can be offset against profits from upstream, LNG, or trading activities, particularly if those profits are generated in entities located in lower-tax jurisdictions or are themselves loss-making.
Key optimization levers include jurisdictional arbitrage, where trading profits are realized in low-tax havens like Switzerland while refining losses occur in high-tax regions such as the EU. Group relief and consolidation mechanisms, like French fiscal integration, allow for intra-group offsets. Capital expenditure timing and depreciation strategies can be adjusted, accelerating depreciation in high-margin periods and harvesting losses during downturns.
Companies also face exposure to windfall taxes during high-margin periods, which can be mitigated by utilizing loss carrybacks or credits during subsequent periods of squeezed margins. Interactions with carbon taxes are also significant; ETS payments are deductible expenses, while free allowances can create windfall-like gains when carbon prices are low.
Stochastic tax modeling can quantify the value of NOLs by simulating various market conditions (crack spreads, oil prices, carbon prices, utilization rates) using techniques like multivariate Geometric Brownian Motion. This modeling helps compute the expected tax shield value from NOLs, which can be expressed as a function of the tax rate, the minimum of cumulative losses and future profits, and a discount rate.
In margin squeeze scenarios with reduced operations, a higher probability of generating NOLs translates to a greater tax shield value, acting as a real-options hedge that partially mitigates equity downside. From a portfolio perspective, similar to BR’s approach, NOL harvesting during downturns enhances the after-tax Sharpe ratio for integrated oil majors compared to pure refiners. Coupled with disciplined capital expenditure driven by intercompany pricing (ICP), this strategy can lower the cost of capital by adjusting the transition beta. Companies maintain low gearing levels, around 15%, ensuring financial flexibility to navigate market cycles and capitalize on tax optimization opportunities.
3. Integrated Impact on TotalEnergies in Margin Squeeze
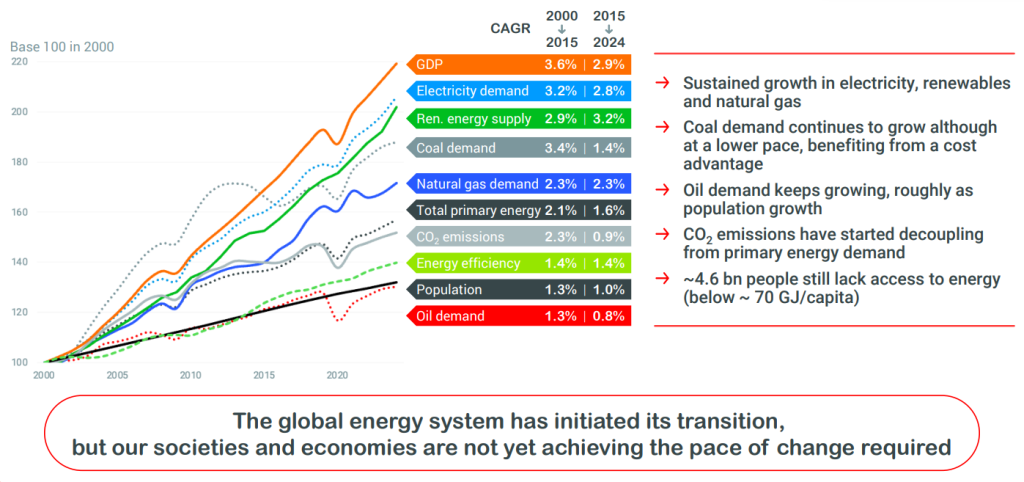
TotalEnergies faces a margin squeeze affecting its ERM sensitivity, with higher carbon taxes increasing costs. Reduced refinery runs lower emissions, offering compliance relief, but worsen fixed-cost absorption, impacting profitability. Long-term strategies involve a significant shift to Integrated Power investments and refining rationalization to maintain value, aligning with IEA’s Net Zero Emissions scenario.
- Official disclosures from TotalEnergies (verifiable public documents, 2022-2026). The statement comes directly from TotalEnergies’ official reports, including: Sustainability & Climate 2025 Progress Report (and previous versions updated in 2026); Universal Registration Document (URD) 2025 (published March 2026); CDP Climate Change Responses (2022-2023 and subsequent years); SASB Reporting and Integrating Climate into our Strategy. ↩︎
Precise and verbatim details (confirmed by sources):
Base case (ICP / Shadow Price): TotalEnergies applies an internal CO₂ price of $100/t (or the prevailing price in a given country if higher) for investment project profitability analysis and impairment tests.
This rule applies from 2023 (effective implementation).
Escalation: Beyond 2030 (or 2031 depending on the documents), the CO₂ price increases by 2% per year.
Sensitivity analysis: Stress scenario: CO₂ price at $200/t (i.e., a shock of +$100/t compared to the base case), with the same 2% annual escalation beyond 2030.
Estimated impact: Approximately -15% on the net present value (discounted present value) of all assets (Upstream + Downstream). Previous estimates (2022) mentioned ~9%; the figure has been updated in recent reports.
Context and historical evolution (for academic rigor): Historically, the internal price was lower (~$30-40/t based on oil price, then linear escalation towards $100/t based on oil price, then linear escalation towards $100/t by 2030).
In 2022, TotalEnergies accelerated: transition to $100/t from 2023 to strengthen Paris Agreement alignment (IEA APS scenario compatible with ~1.7°C, Brent ~$50/b).
Usage: Screening of new projects (greenfield/brownfield). Asset impairment tests (IAS 36 / IFRS). Comparison of GHG intensity of projects (e.g., threshold <19-20 kgCO₂e/boe for upstream). These elements are integrated into NPV models and investment robustness analysis, combined with a hydrocarbon price scenario compatible with the Paris Agreement.
Direct links to primary sources (recommended for audit): Sustainability & Climate 2025 Progress Report (PDF on totalenergies.com). URD 2025 (March 2026). CDP responses (available on the website).