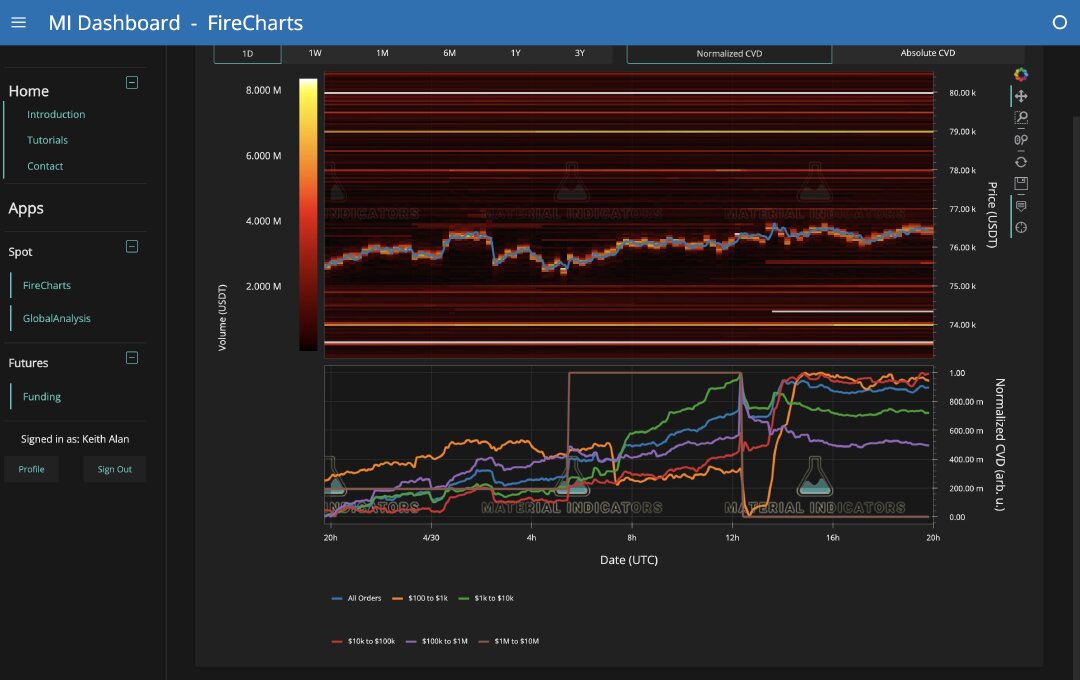
Cohort-Normalized CVD (Cumulative Volume Delta): Colored lines reveal that small orders ($100–$10K, green/orange lines) are buying on upward moves, while large blocks ($1M+, purple lines) are selling.
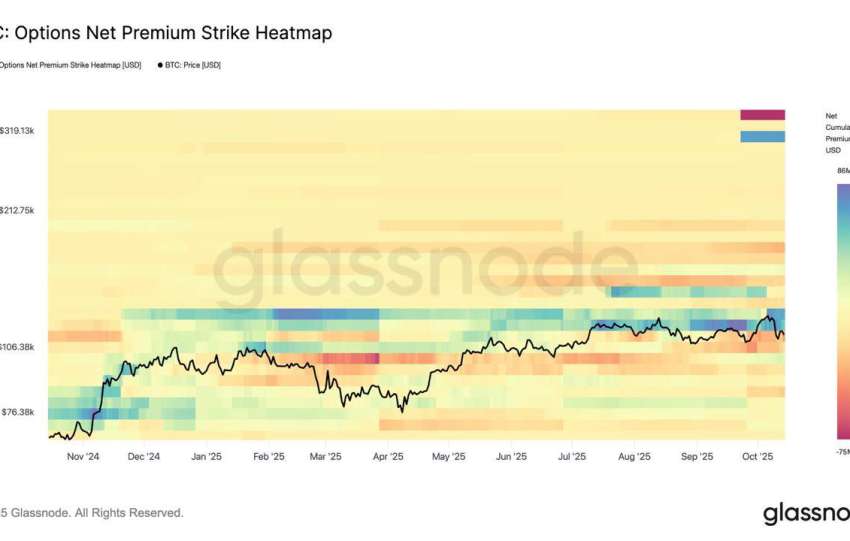
Correlation with our April 27th statements : The April 27th post hypothesized a “stealth institutional distribution” in the $77,000–$80,000 range, with a negative delta of –699.51 and a high VPIN.
The attached chart confirms this hypothesis with superior temporal granularity: seller order flow toxicity (order flow toxicity in the sense of Easley-López de Prado-O’Hara) is generated by the systematic selling by whales to retail buyers.
This phenomenon is the microstructure signature of a risk transfer: “strong hands” (COT Asset Managers, +82 contracts on April 21) are distributing to “weak hands” (retail, Small Traders Legacy COT –402 WoW).
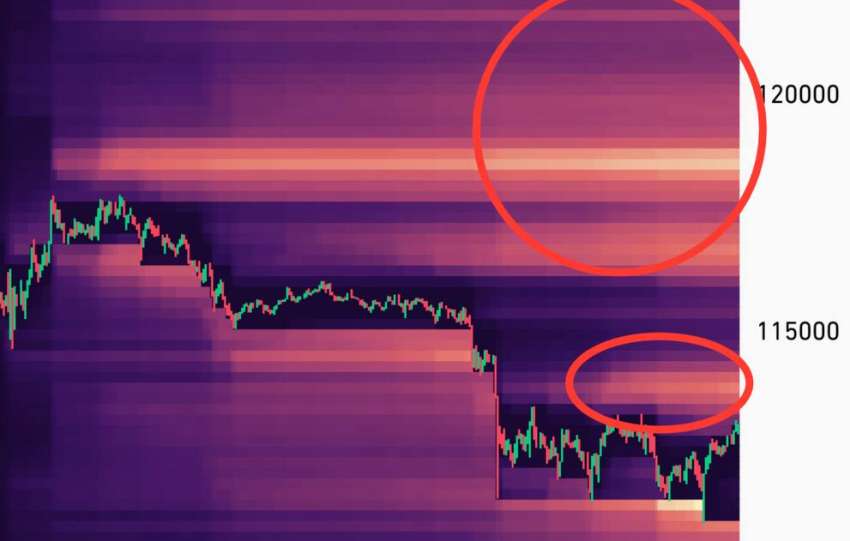
Quantitative Implication: a high λ in the $77,800–$80,000 zone indicates that the informed are selling. The absorption of retail bids creates an illusion of support: the liquidity clusters visible on the heatmap are late stop-losses and retail limit orders, not institutional funds. This partially invalidates the “institutional support” thesis of $75,000 mentioned yesterday.
___________________________
The “Grinder” scenario (range compression) is reinforced to 50% (up from 40% on April 30th), the “Trap” scenario (bearish double liquidation) rises to 25% with a possible extension towards $59,000 if the $73,400 threshold is broken, and the “Squeeze” scenario (bullish breakout) is reduced to 20% considering the confluent resistance at $77,800–$80,000 and the FOMC 6/6 dumps pattern. A new “Deep Capitulation” scenario (< $59K) emerges with a 5% probability, conditioned on the break of $73,400.
Scenario A: “The Grinder”, Range Compression
¤ Triggers:
Maintaining the $74,000–$78,000 range with negative CVD but $75K support holding. FOMC “higher for longer” without hawkish shock. Continued whale-to-retail distribution (FireCharts).
¤ Trajectory:
BTC: Oscillations between $74,500 and $77,500 for 2–3 weeks.
NASDAQ: Range of 17,200–18,200 (low decorrelation).