The distinction between a "trap" and a "trigger" in market analysis centers on their nature, observability, agents involved, and timing.
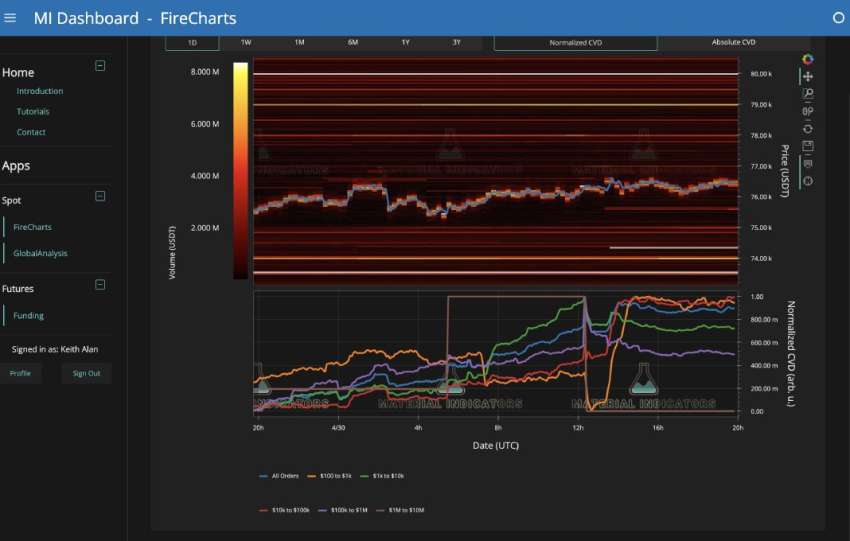
A trap is a static liquidity configuration, often visible in liquidity heatmaps as bid clusters (e.g., 76K–80K), indicating passive retail accumulation and suggesting resistance (high Kyle's Lambda). This configuration can take hours or days…
Cohort-Normalized CVD (Cumulative Volume Delta): Colored lines reveal that small orders ($100–$10K, green/orange lines) are buying on upward moves, while large blocks ($1M+, purple lines) are selling. Correlation with our April 27th statements : The April 27th post hypothesized a "stealth institutional distribution" in the $77,000–$80,000 range, with a negative delta of –699.51 and a…