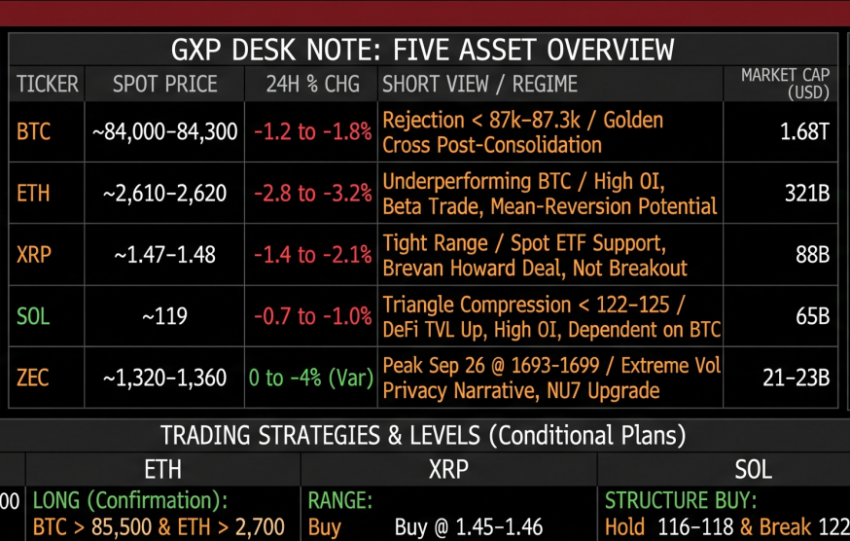
Three macro variables dominate the pricing of five crypto assets today. The August CPI, released on September 11, is the last inflation print before the FOMC. A “hot” print raises perceived r* and compresses crypto duration, while a disinflationary print reopens the hold scenario.
The FOMC meeting on September 15-16 has hike probabilities of +25 bp often cited in the 55-70% band, depending on the source and day (CME, Polymarket, commentators). This is not a stable consensus but a two-way event. The CLARITY Act, with a procedural vote around September 15, is a catalyst for US market structure, more material for XRP, ETH, and SOL (regarding asset status and ETF rails) than for Bitcoin as a store of value. In a Risk-Off Fed regime, betas relative to Bitcoin are as follows: ETH/BTC ~1.1-1.3, SOL/BTC ~1.4-1.8, XRP/BTC ~1.1-1.5, and ZEC/BTC is unstable, having decoupled upward via ETF and privacy narrative, then recoupled downward via profit-taking.
A single-factor model, where return = alpha + beta * BTC return + gamma * 10-year yield change + error, still explains most daily variance for major assets. ZEC is the only one where gamma and an idiosyncratic “privacy-ETF” factor dominate at times. As of September 1, 2026, Bitcoin CME COT data shows OI of ~19,697 contracts, large specs net long reduced to 703 (down 1,246 from last week), commercials net short at -1,077 but covering +713, and leveraged funds still clearly short. This suggests no extreme long spec crowding; rather, a two-way institutional market compatible with a 75-82k range, not a one-way squeeze. US Bitcoin ETF complex has an AUM of ~97-101 B$, cumulative flows since 2024 of ~+55 B$. The latest week was still net positive, but September 8-10 saw outflows, including ~-283 M$ on Sept 10. IBIT remains the swing factor for the complex.