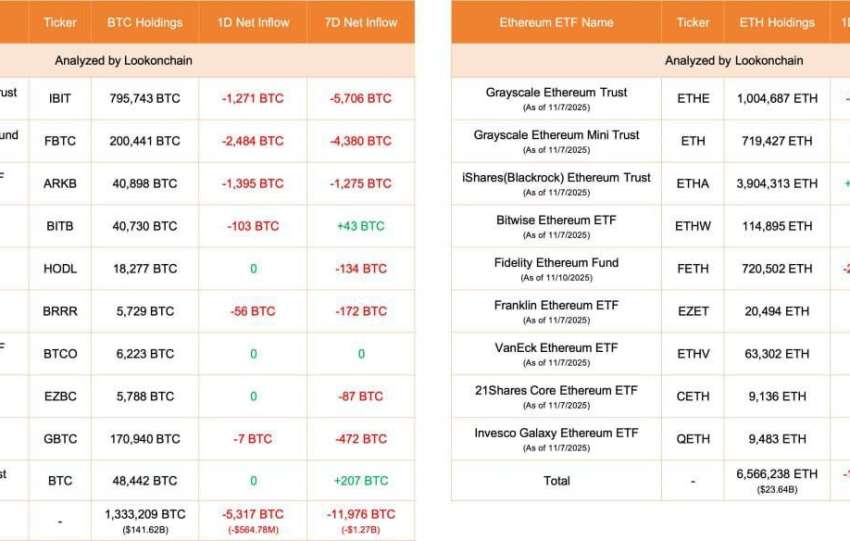
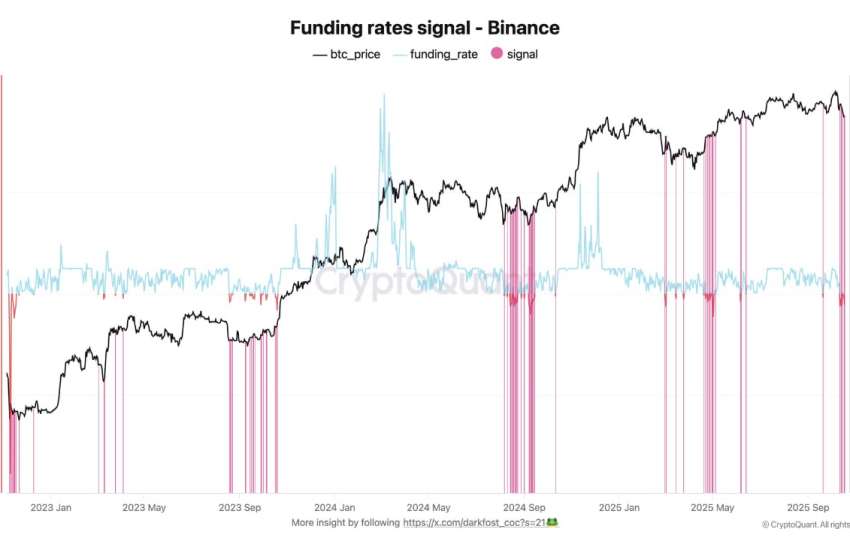
Bitcoin functions as a systemic anchor and market factor. Its circulating supply stands at approximately 19.95–20.08 million BTC. US spot ETFs hold aggregate assets of around 1.3 million BTC, representing about 6–6.5% of the float, with cumulative net inflows of roughly $52 billion despite outflows in 2026.
The ETF channel has replaced the “miner overhang” as a short-term equilibrium variable. A reduced-form flow equilibrium is expressed as: DP_t = (1/λ_t) · (F_ETF_t + F_corp_t – S_miner_t – S_LTH_t – S_perp_t), where λ_t is the Kyle depth of spot plus ETF primary market.
In August, a short squeeze fueled a ~26% rally from mid-August lows, supported by Glassnode‘s report of the strongest ETF creation week of the year and multi-cohort accumulation. However, this does not signal a new cycle bull market; the Glassnode cycle composite only moved from the “cold” band to ~40 (neutral) after seven months below.
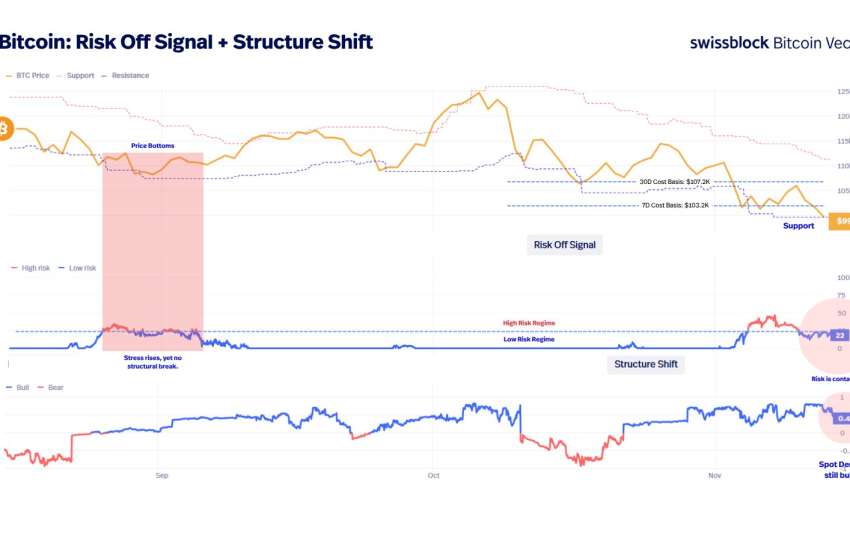
On-chain metrics are useful but not oracular. The MVRV ratio (Market Cap / Realized Cap) touched ~1.1 in mid-year, near aggregate break-even, typical of late bear phases or mid-cycle resets, not tops (historical MVRV-Z tops > 3). The short-term holder (STH) cost basis oscillated between $68k–$73k, while the current spot price of ~$78.5k puts the STH cohort in slight profit (7-day STH-SOPR ~1.03 at end of August). This signals potential selling pressure, not completed distribution. Binance reserves rose to ~685k BTC at end of August, indicating potential supply, not an active sell order.
Global exchange reserves remain lower than 2022 levels (~2.7–3.0 million BTC), consistent with ETF custody. A supply wall is identified at $81k–$86k (ETF average cost, realized price shelves, and gamma dealer flips). Empirical support levels are $77k, $70k (50-day EMA), and $62k–$65k (summer floor). Derivatives and microstructure show high futures open interest (end of August: ~$54.8B / ~695k BTC). Options max pain for September is concentrated at $70k–$73k, acting as a bearish magnet if spot stagnates.
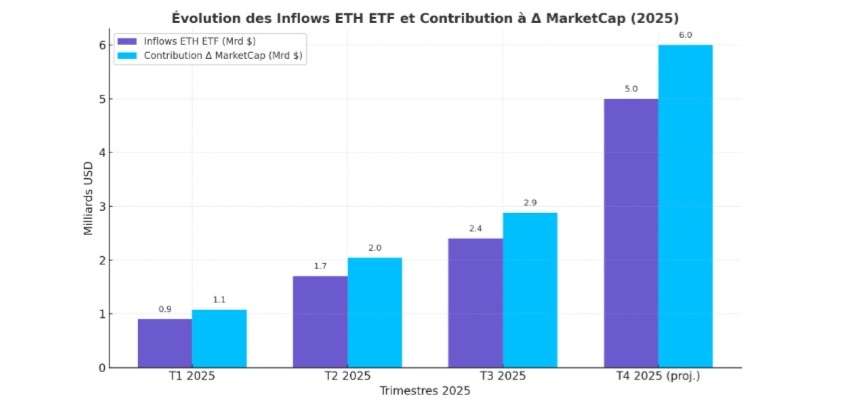
Ethereum is an option on tokenized settlement. At ~$2,460, with a market cap of ~$297 billion and a dominance of ~11%, its beta to Bitcoin remains high (daily r of 0.75–0.90). However, its idiosyncratic factor in 2026 is the ETF flow differential. In August, some weeks saw ETH ETF creations more capital-efficient than BTC when normalized by market cap, signaling a potential institutional rotation to smart-contract assets, not a “flippening.”
Using a real options framework (Dixit-Pindyck), ETH’s value is not a discounted cash flow of EIP-1559 burn fees. Instead, it represents the value of a platform whose usage cash flows (L2 settlement, stablecoins, RWA, restaking) are an expansion option exercised if: (i) US regulatory clarity holds, (ii) L2s compress unit costs, and (iii) real staking yield exceeds the T-bill opportunity cost. Formally, V_ETH = S_t · Q(usage) + e^(-rT) E[max(V_plat(q) – I, 0)] – dilution_issuance-burn, where q captures the regime (MiCA/CLARITY/ETF staking). The burn has not compensated supply in all phases of 2025–26, so treating ETH as “ultrasound money” without considering net issuance is a model error. Technical support is at $2,400, with a bullish breakout discussed towards $2,550 and then $2,800. The roadmap includes Glamsterdam/ePBS in testing, targeting H2 2026 as a throughput catalyst, not a mechanical price driver.
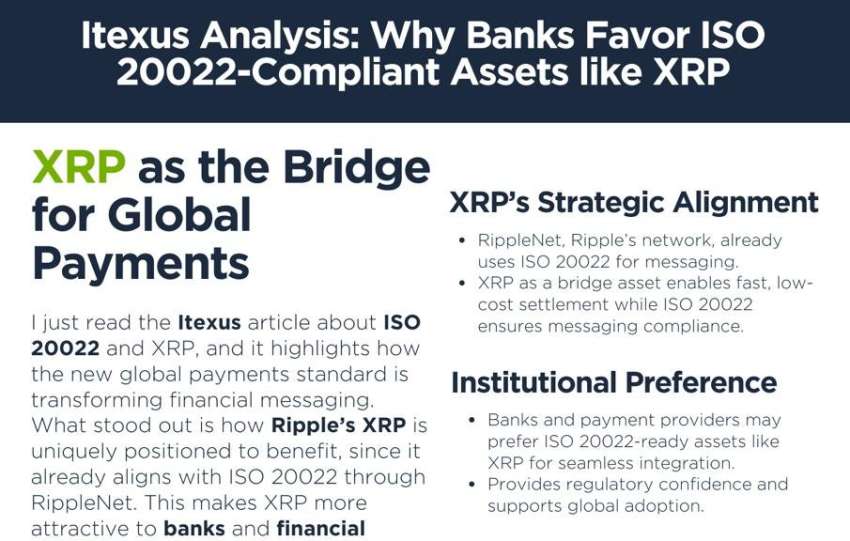
XRP is a regulated asset with administered supply and a legislative option. At ~$1.37, with a market cap of ~$86 billion, its supply is not mined but managed. On September 1, 2026, Ripple unlocked 1.0 billion XRP from on-ledger escrow, leaving ~31.28 billion XRP (~31.3% of the original 100 billion supply). From 2018–2026, net escrow reduction averaged ~221 million XRP per month, not 1 billion, resulting in a net circulating flow of ~2–4% annualized—a structural dilution absent in Bitcoin.
Spot XRP ETFs are active in 2026 (Bitwise, Franklin, Canary, Grayscale, etc.), with cumulative inflows of ~$1.3–1.6 billion, though no individual fund reaches $1 billion AUM (contrasting with SOL staking ETFs). An August inflow streak (10 sessions, weekly >$110 million) represents real demand but is too small to absorb accelerated Ripple distribution if CLARITY passes and Ripple boosts distribution (a risk noted in filings). Utility includes ODL corridors and RLUSD (Ripple’s stablecoin), which exceeded $1.0 billion float on the XRPL in late August, dominating ledgers’ stablecoins (~82%).
RWA tokenization on the XRPL rose sharply in Q2. The “XRP = oil of interbank settlement” thesis remains a real option, not an observable cash flow justifying a multi-hundred billion market cap. Relative valuation positions XRP as a regulatory claim plus administered float plus crypto beta. In a three-player game theory {Senate, Ripple, ETF APs}, if CLARITY fails (~80%+ failure probability in 2026), the legislative option partially expires, and the multiple contracts. If CLARITY passes, two equilibria exist: (A) ETF inflows plus banks lead to re-rating; (B) Ripple accelerates unlocks, creating a supply wall. Retail has insufficiently priced equilibrium (B).
Solana offers high technological convexity but non-zero operational risk. At ~$103, with a market cap of ~$60 billion and robust daily volume (~$3 billion), it has the highest beta in the basket, driving outperformance in some August windows and underperformance during rate hikes. ETFs include spot and staking products (e.g., BSOL Bitwise >$1 billion AUM, native yield ~5.8%), an architectural advantage over XRP.
The protocol catalyst is Alpenglow (SIMD-0326, supported by 98.27% of validators), replacing TowerBFT with a target finality of ~100–150 ms versus ~12.8 seconds. Code is embedded in Agave 4.2 (currently off), with mainnet switch targeted via Agave 4.3 in October 2026 (not September). Phase 1 is Votor only; Rotor (propagation) comes later. Given testnet incidents in May, activation risk is not trivial. A post-upgrade halt is a left-tail risk that 30-day options often underestimate. Legitimate “smart money” signals include ETF staking flows, on-chain DEX/perp activity, and open interest. Illegitimate reads include inventing Alphascope/Hyperliquid clusters without extraction. Hyperliquid is a distinct large-cap; using it as a proxy for SOL positioning is a questionable shortcut.