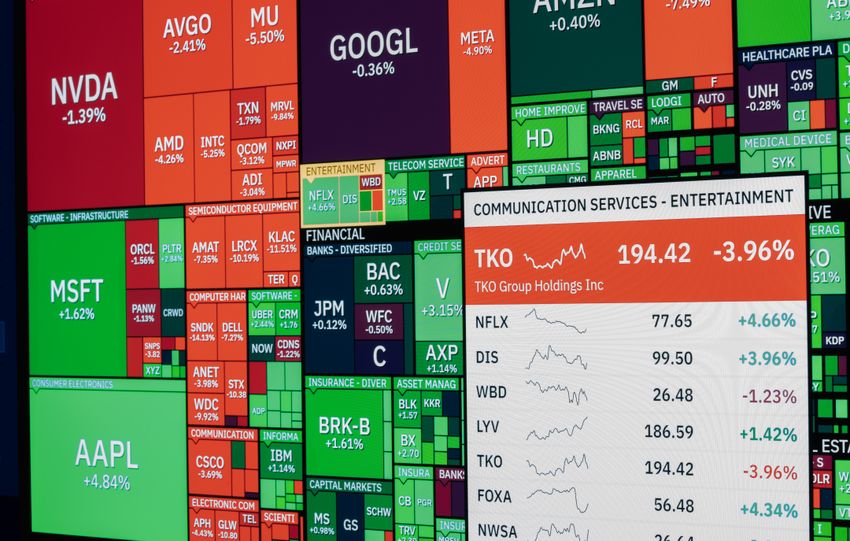
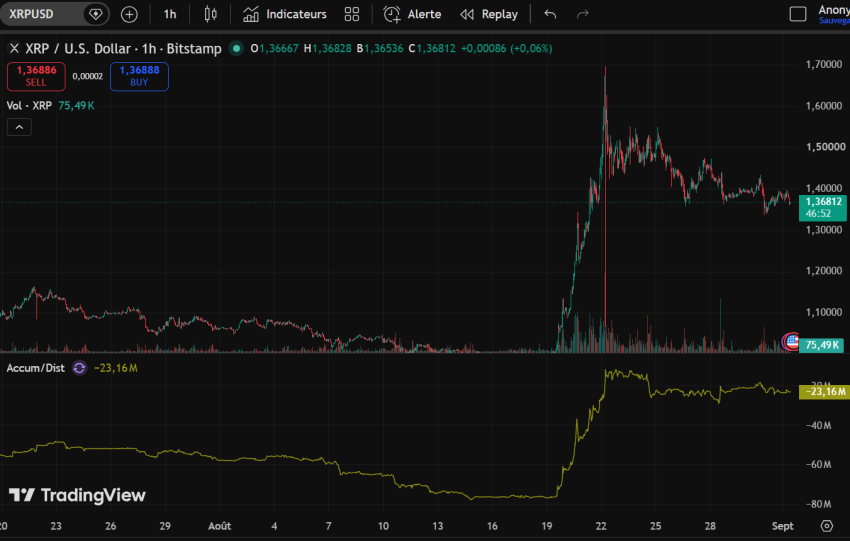
As of October 6, 2026, the crypto market capitalization is approximately $2.92 trillion, representing about 2.9% of the U.S. listed equity market. Bitcoin (BTC) dominates at 59%, trading between $85,300 and $86,000, but remains 32% below its all-time high of $126,080 from October 6, 2025. Ethereum (ETH) holds 11.3% of the market at ~$2,720, underperforming…
In a few months, in 2027, a cross-border payment whose beneficiary address is entered in free text will be rejected by the SWIFT network. Not delayed: rejected, before even reaching the first bank in the chain. SEPA will follow the next day, in 2027. This deadline, almost unnoticed by the general public, is in fact…
Gold was indeed a high-Sharpe asset during certain windows from 2025 to early 2026, and long-term bonds did under perform. However, as of September 7, 2026, gold does not "beat tech stocks" over 12 months. NVDA and the S&P have higher TTM returns than those shown in the table.
The illustrative recalibration (TTM window,…
Oil prices surged sharply after the US announced new strikes on southern Iran. Brent crude exceeded $92 per barrel, while WTI approached $90. Yields on 30-year Japanese government bonds (JGBs) surpassed 4.18%, and Nvidia exited the corporate bond market. How does this affect gold? Several explosions were reported near Bandar Abbas, Qeshm, and the Strait…
Bitcoin functions as a systemic anchor and market factor. Its circulating supply stands at approximately 19.95–20.08 million BTC. US spot ETFs hold aggregate assets of around 1.3 million BTC, representing about 6–6.5% of the float, with cumulative net inflows of roughly $52 billion despite outflows in 2026.
The ETF channel has replaced the "miner overhang"…
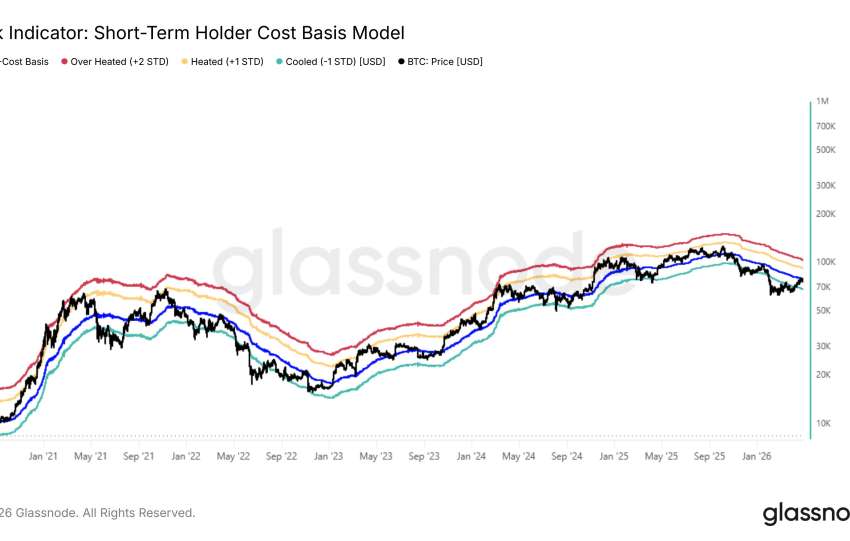
Analysis of Glassnode data as of April 30, 2026, reveals an unprecedented structural compression: Bitcoin is "trapped below market mean," trading at approximately $76,000, below the True Market Mean (around $81,500) and the STH Cost Basis (around $83,000), in a "Cooled" zone (-1σ). The Spot Volume Delta (7-day MA) indicates a stabilization of net selling…
I. État des lieux. L'Open Interest (OI) et le levier systémique
Depuis le 1er janvier 2026, l’Open Interest agrégé a chuté de 14 milliards $, signalant un unwinding (dénouement) massif des positions à effet de levier. Cependant, la stabilisation actuelle autour de $66,700 a favorisé une reconstruction rapide de positions Short agressives par des…
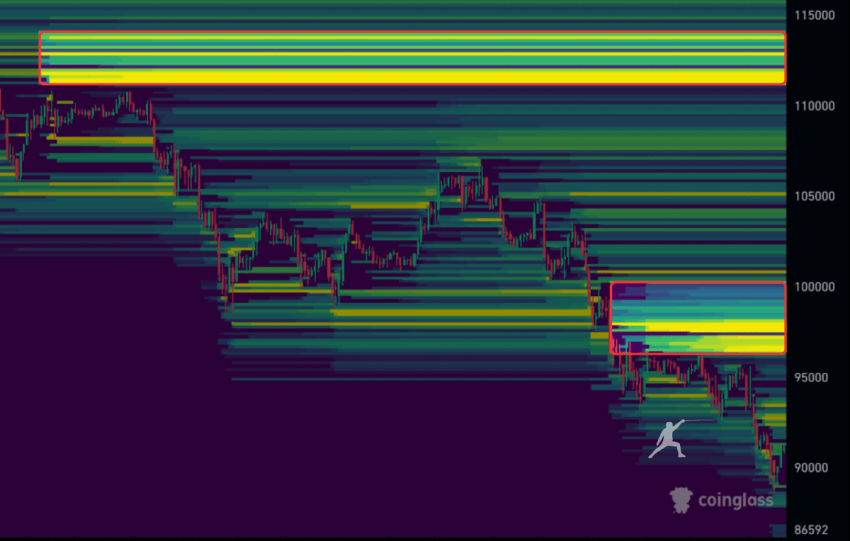
1. MATRICE « LIQUIDITY HEAT-MAP » (75 k → 100 k) – MISE À JOUR PRIX 82 351 $
Zone $Notional LongsNotional ShortsGamma Exposure ΔMM Hedge FlowProba 48hEvent Trigger 75 00050 M320 M–22 M12 %Stop-run daily low (proche)76 80090 M280 M–18 M14 %Micro rebound78 500450 M90 M–31 M22 %Max long squeeze80 200380 M70 M–19 M16…
1. FAITS CHIFFRES
IndicateurTexte / ImageDonnées marché (21 nov 2025, 09h00 UTC)StatutLiquidations totales 24h2,01 Md $ 2,05 Md $ (Coinglass)✅Part longue1,87 Md $ (93 %)1,90 Md $ (92 %)✅Part courte144 M $ (7 %)155 M $ (8 %)✅Cap. boursière US-1 000 Md $ -1 050 Md $ (Bloomberg)✅Cap. crypto-120 Md $ -123 Md $…
I. OPERATIONAL SUMMARY: THE CLEAN SWEEP
A. Context: From 26K to $89K, is it really a Bear Market or a Final Reset?
The 30% correction from the October peak (above 26,000) to the $89,000 zone is not a Bear Market. It's a final Clean Sweep that resets the market before the parabolic growth phase.
…
Analyse de marché