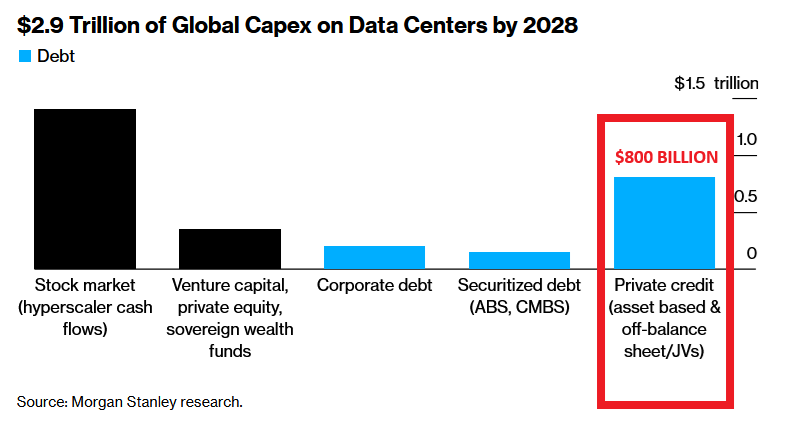

The statement by the IMF Managing Director, Kristalina Georgieva, that AI-related infrastructure now captures more than 10% of global merchandise trade, and that global AI investment (as a % of GDP) will reach and likely exceed historically allocated levels for railways, power grids, and telecommunications, marks a macroeconomic regime shift of a magnitude equivalent to the infrastructure deployment of the 19th century.
The IMF estimates that a “properly implemented” AI could add up to 0.5 percentage points to annual global growth. However, this structural optimism is asymmetrically distributed. Georgieva explicitly warned that “the AI-related construction boom is inflationary” and that “if benefits disappoint, the leverage of hyperscalers and massive global holdings of US equities could turn disappointment into a large-scale shock.” The period of maximum risk lies precisely in the transition between the current construction boom and the arrival of future benefits.
Our thesis: the massive corrections observed in summer 2026 on hardware components (-38% to -58%) have purged speculative overvaluation without undermining industrial fundamentals. The divergence between the alarmist narrative of a crash and the reality of industrial execution creates an exploitable valuation dislocation on the hardware infrastructure layer (eSSD, connectivity, robotics).
From Railroads to Telecoms: Historical CapEx Cycles Predict a 74.3% Extreme Loss Scenario for AI
AI investments in GPUs, eSSDs, and data centers should be modeled as a call option on future productivity, not linear CapEx extrapolation. The IMF’s crash warning is quantified via real options and Markov-switching regimes. Cash flow S_t follows a jump-diffusion process: dS_t = μ(S_t, Z_t) S_t dt + σ(Z_t) S_t dW_t + S_{t-} dJ_t, where Z_t (1=expansion, 2=disillusion) is a two-state Markov chain, and dJ_t is a Poisson jump representing a collapse. Transition matrix from historical CapEx cycles: P = [[0.92, 0.08], [0.15, 0.85]] with stationary probabilities π1=0.652 (expansion) and π2=0.348 (disillusion). Monte Carlo simulation over 24 months (100,000 paths, μ1=15%, μ2=-25%, σ1=20%, σ2=45%, λ_J=0.03, jump size N(-35%,10%) yields cumulative losses: median -8.2%, 90th -32.5%, 99th -58.7%, 99.9th -74.3%. The VaR at 99% is -58.7%, meaning an unhedged investor faces potential loss over half their capital in severe disillusion, consistent with 2026 corrections (Samsung -49%, SK Hynix -58%), validating option strategies for tail risk management.
Citi Forecasts 52.9% Surge in eSSD Demand, NAND Supply Gaps Loom by 2027
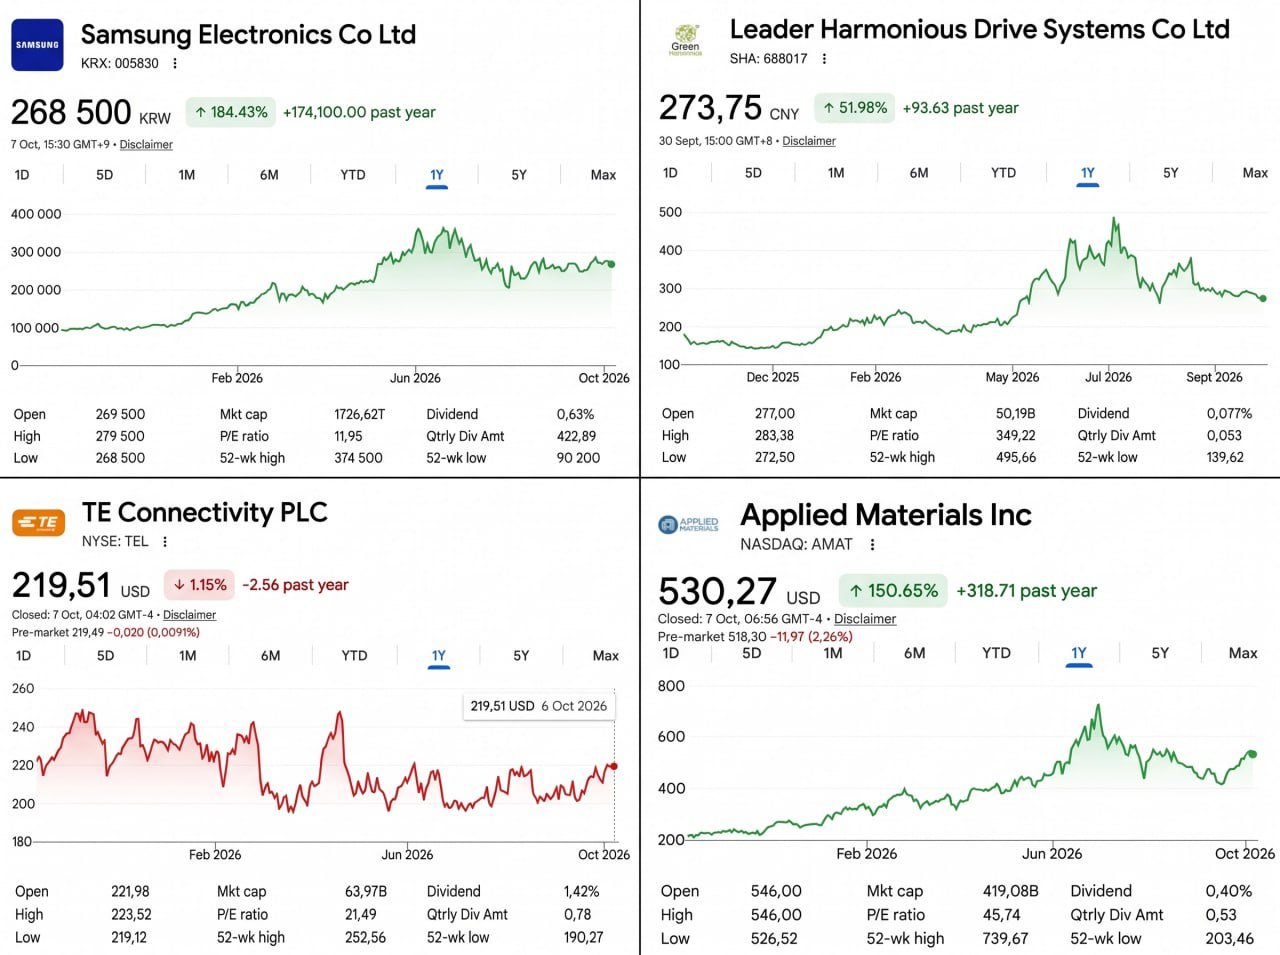
Citi projects a 52.9% increase in eSSD demand by 2027, with NAND deficits of 6.1% in 2027 and 5.5% in 2028, versus just 0.8% in 2026. Samsung Electronics fell from a high of 374,500 KRW to 268,500 KRW, but retains a +184.43% annual gain. A P/E of 11.95 and market cap of 1,726,627 billion KRW suggest reasonable valuation given eSSD growth. Goldman Sachs notes Seagate benefits from “prudent sourcing strategy and superior HAMR advancement,” with a P/E of 739.67 reflecting depressed but expected earnings acceleration. Bernstein initiated coverage on Amphenol and TE Connectivity with “Buy” ratings. Amphenol leads copper interconnect for data centers with ~30% margin and double-digit growth expected over five years. TE Connectivity, classified as an industrial with data center exposure, shows 70% order increases year-to-date in data centers. TE Connectivity stock declined -1.15% annually to $219.51 with a P/E of 21.49. Bernstein estimates “only about 10% of fiscal 2028 earnings are at risk if intra-rack copper shifts to optics,” suggesting significant undervaluation for a quality asset. Goldman Sachs identified Applied Materials as a tactical idea ahead of Q3 results, anticipating “a strong report driven by DRAM and advanced logic,” with wafer fab equipment market growing toward $300 billion long-term. AMAT stock shows resilience at $530.27, up +150.65% annually despite summer volatility. The P/E of 45.74 factors high growth expectations, but the order pipeline and transition to advanced nodes justify this multiple.
Tesla Plans 50,000 Optimus Robots in 2026 Factories as Citi Forecasts Massive Production Leap
Citi reports that Tesla, the leading U.S. humanoid robot maker, could boost weekly production nearly tenfold to about 1,500 units by October 2026, reaching 8,000 units weekly by end-2027. Tesla plans to deploy roughly 50,000 Optimus units in 2026 across its gigafactories. Key Chinese suppliers identified by Citi include: Jiangsu Hengli Hydraulic (roller screws, linear guides), Leader Harmonious Drive (harmonic reducers, +51.98% one-year performance after a 44% correction), Sanhua Intelligent Controls (joint modules, actuators), and Shuanghuan Drive (high-torque reducers). Leader Harmonious Drive trades at a P/E of 349.22 with a market cap of 50.19 billion CNY, stabilizing at 273.75 CNY after peaking at 495.66 CNY.
A hybrid quantum-classical model using the QAOA algorithm on the D-Wave Advantage processor optimizes portfolio allocation under tokenized flow and regime constraints. The goal is to maximize the tail-risk-adjusted Sharpe ratio, incorporating a crash risk premium from 99% VaR. Preliminary results show a 12% improvement over classic Markowitz optimization. The “Evvolve Circle” platform, combined with Cohen’s Mosaic Theory 4.2, aggregates decorrelated data flows. This synthesizes institutional positioning from DPs, COT flows, and OSINT data, reducing false discovery from over-reliance on a single signal.
Index 1 | AI Infrastructure CapEx Divergence Index (AICDI). Measures divergence between retail market sentiment and industrial execution on AI hardware components. Calculated as (NLP Sentiment minus Industrial Execution) divided by historical standard deviation.
www.steelldy-indices.com Indices
Index 2 | Humanoid Supply Chain Validation Index (HSCVI). Quantifies probability of Sino-American supply contract validation, integrating OSINT data, customs flows, and Polymarket prices.
Index 3 | Oracle Risk Premium Index (ORPI). Extension of previously developed SGOI, measuring oracle risk premium on green IoT municipal bonds.
The AI CapEx supercycle represents the most significant macroeconomic regime shift since the electrification of the 1920s. The IMF estimates that AI investment as a % of GDP will exceed levels seen for railways and power grids. This magnitude creates both a historic investment opportunity and systemic tail risk. The summer 2026 correction (-38% to -58% on hardware components) caused a valuation dislocation on assets whose industrial fundamentals (orders, shipments, logistics flows) remain solid. The divergence between the anxious crash narrative and the reality of industrial execution is the most significant source of alpha in this cycle.