Analyse de marché

Middle East oil recovery and supply-demand dynamic
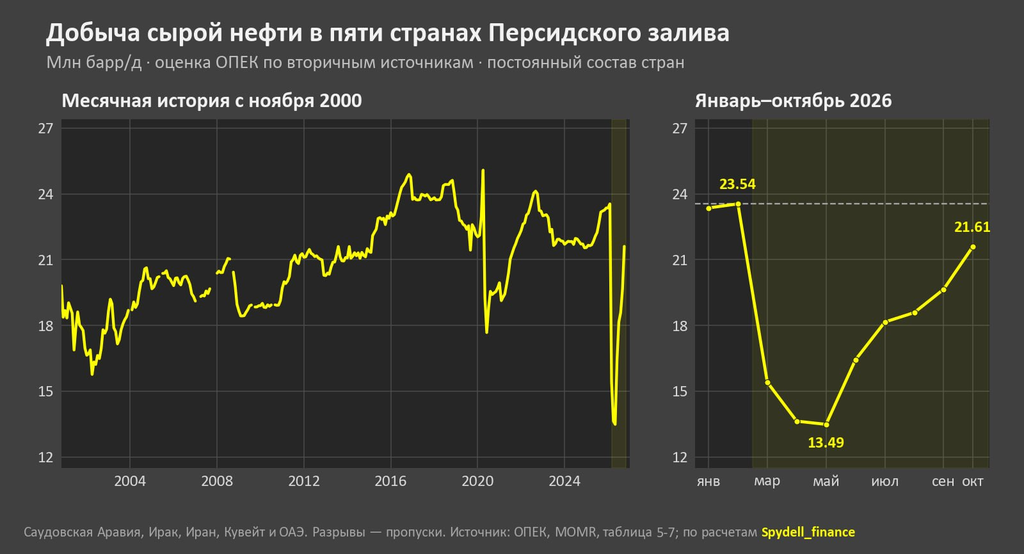
Five largest Persian Gulf oil producers raised output to 21.61 million barrels per day by October, recovering 81% of the production lost by May. In February they produced 23.54 million, in March 15.41 million, and in May 13.49 million, the lowest since November 2000. By October they had recovered 8.12 million out of the missing 10.05 million barrels per day, according to OPEC secondary sources on 11 November 2026.
Seven Middle Eastern countries increased production from 14.46 million barrels per day in May to 22.68 million by October, recovering 82% of the volume lost between February and May, with a total gain of 8.22 million from the May low. Monthly growth slowed from a June jump of 2.95 million to 0.47 million in August, then accelerated to 1.96 million in October. Iraq contributed the most (+2.97 million barrels per day), followed by Saudi Arabia (+2.24 million) and the UAE (+1.84 million), together accounting for 86% of the net increase among the seven countries. Kuwait added 1.43 million. Iran moved in the opposite direction, with output falling from 2.28 million to 1.91 million, partly restraining regional recovery.
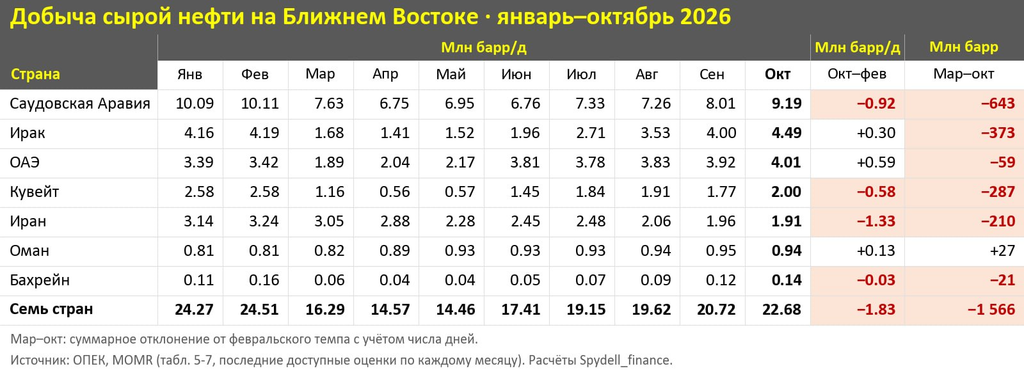
By October the seven countries still produced 1.83 million barrels per day (7.5%) less than in February. Iraq, the UAE and Oman exceeded their February levels by 0.30 million, 0.59 million and 0.13 million respectively, but this did not offset Iran’s shortfall of 1.33 million, Saudi Arabia’s 0.92 million and Kuwait’s 0.58 million. The cumulative shortfall from March to October reached 1.57 billion barrels, or 26% of what the seven countries would have produced if they had maintained the February rate adjusted for the number of days in each month. Saudi Arabia accounted for 643 million barrels, Iraq for 373 million and Kuwait for 287 million, together 83% of the total losses. Thus Iraq’s return above the pre-crisis level has not compensated for the earlier shortfall.
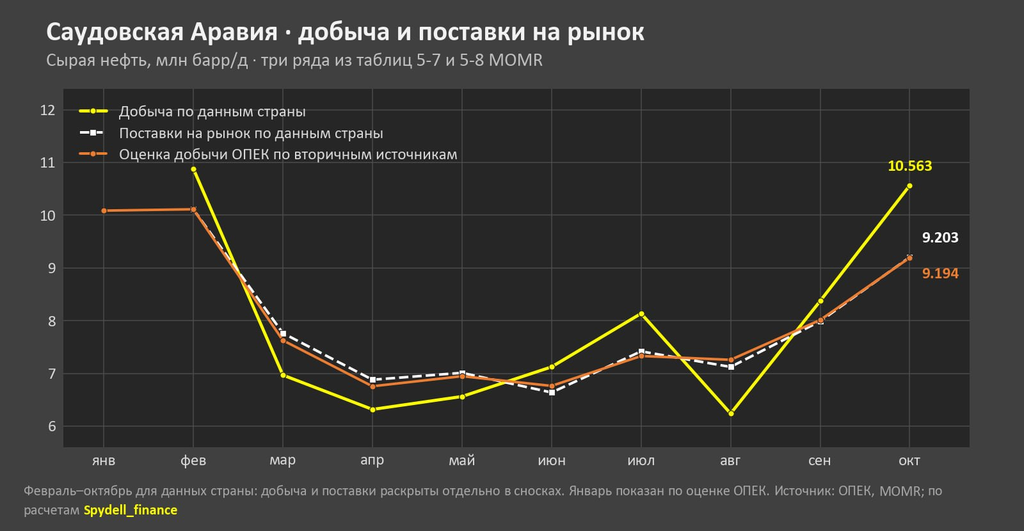
Excluding Iran, the output of Middle Eastern countries is roughly at the pre-crisis level, with a decline of only 0.5 million barrels per day, which is a statistical error and natural background volatility, based on OPEC data. Saudi Arabia reported production of 10.563 million barrels per day and deliveries to market of 9.203 million; production rose by 2.19 million month on month and approached the pre-crisis February level of 10.882 million, while deliveries rose by 1.22 million and remain 0.91 million below February. OPEC’s secondary source estimate of 9.194 million is close to Saudi deliveries. The difference between production and deliveries in October was 1.36 million barrels per day, and data on stocks and internal flows would be needed to allocate it.
Supply recovery outpaced demand: from March to October global supply of oil and derivatives rose from 96.41 to 104.47 million barrels per day, while consumption rose from 101.97 to 102.78 million, according to EIA’s November data series, which differs somewhat from OPEC. Supply was still 4.25 million below February. From September to October supply rose by 1.39 million, consumption fell by 1.27 million, and the first estimated surplus since February appeared at 1.69 million barrels per day. The cumulative deficit for March–October was about 572 million barrels for global oil deliveries.
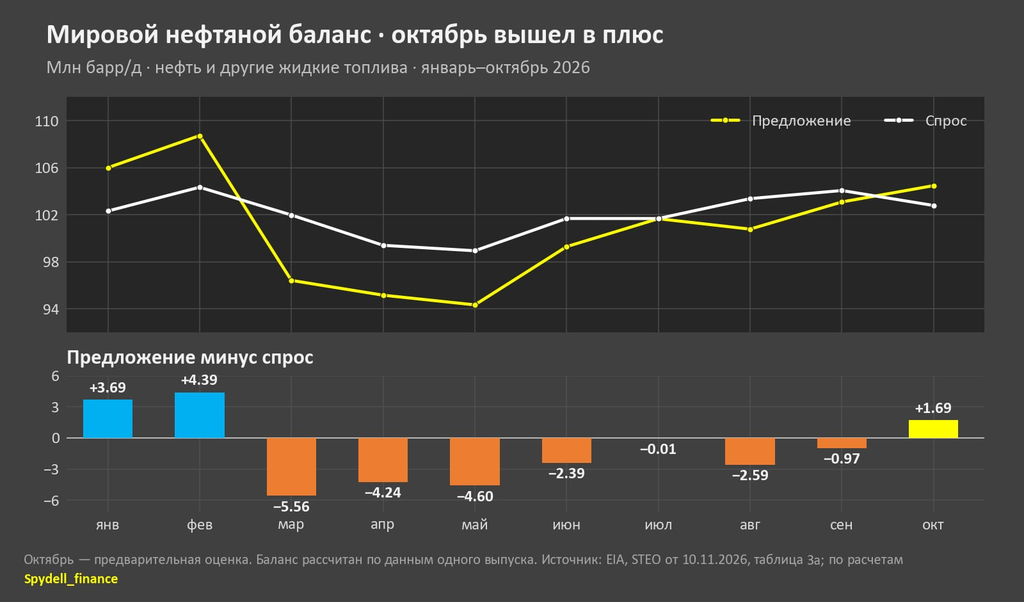
The size of the deficit depends primarily on demand estimates. In Q3 2026, supply according to OPEC and EIA nearly matched at about 101.8 million barrels per day, but demand estimates diverged by 2.95 million, resulting in a deficit of 4.16 million barrels per day from OPEC and 1.20 million from EIA. Since March, OPEC has lowered its 2026 demand growth forecast from 1.38 to 0.18 million barrels per day, while EIA revised its forecast from growth of 1.23 million to a decline of 2.03 million.
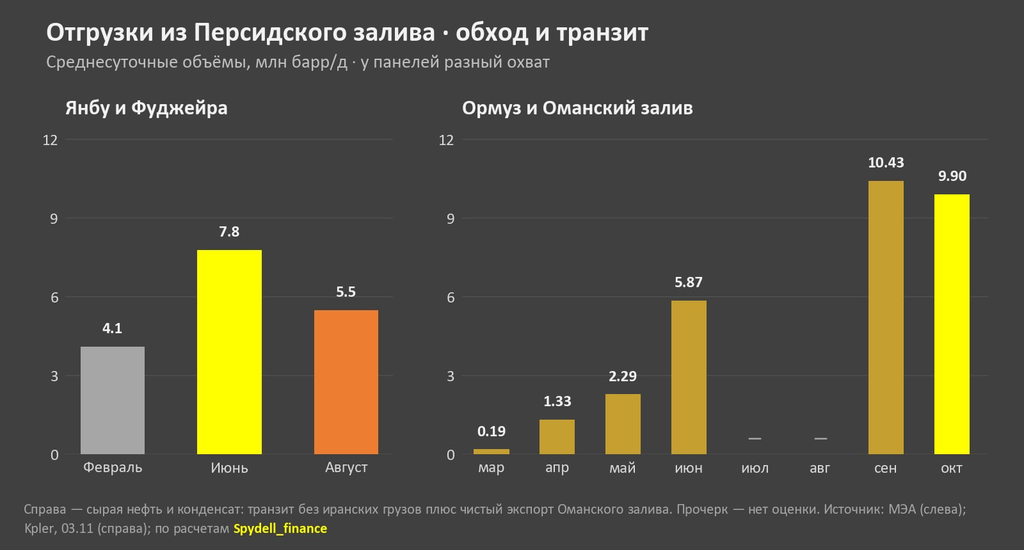
On the supply side outside the DoC, OPEC expects a 1.26 million barrels per day increase from Brazil, the US, Canada and Argentina together. It forecasts that in Qatar alone, output of oil and oil products, including condensate and gas liquids, will decline by 0.86 million. Bypass routes covered only part of the lost transit. Loadings from Yanbu and Fujairah rose from 4.1 million barrels per day in February to 7.8 million in June, then fell to 5.5 million in August. For March–August, the IEA estimates that bypass added more than 500 million barrels against a shortfall of about 2.8 billion through the Strait. According to the IEA, in September 10.9 million barrels per day passed through Hormuz, including ship-to-ship transfers off Oman, while another 5.6 million went via bypass routes. In a narrower Kpler series covering crude oil and condensate through Hormuz excluding Iranian cargoes plus net exports from the Gulf of Oman, October loadings were 9.90 million barrels per day after 10.43 million in September.
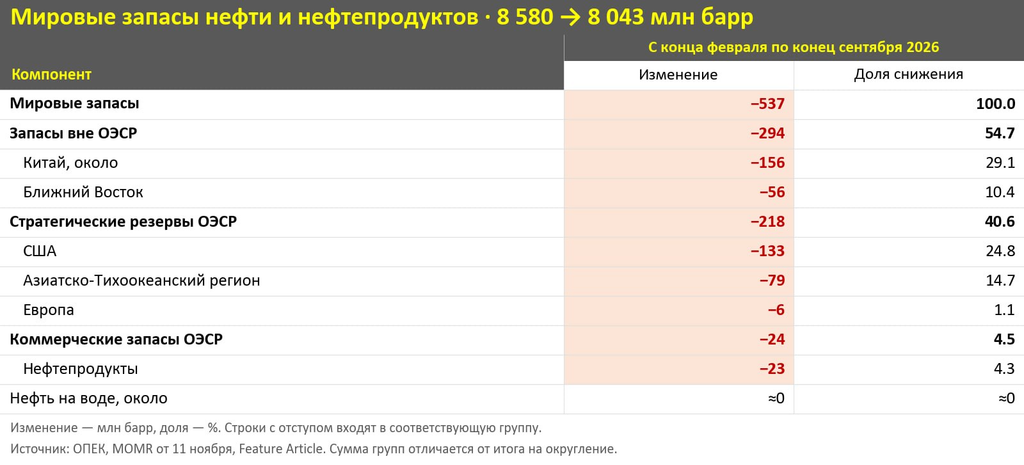
The shock primarily affected reserves and stocks outside the OECD. OPEC estimates a global stock draw of 537 million barrels from end-February to end-September, while the IEA estimates 509 million. According to OPEC, 294 million came from non-OECD stocks, including about 156 million in China, and 218 million from OECD strategic reserves; inside the OECD the main draw was evidently from the US. OECD commercial stocks fell by 24 million barrels, almost entirely due to oil products. Oil on water remained roughly unchanged, as a decline in floating storage was offset by cargoes on longer voyages.
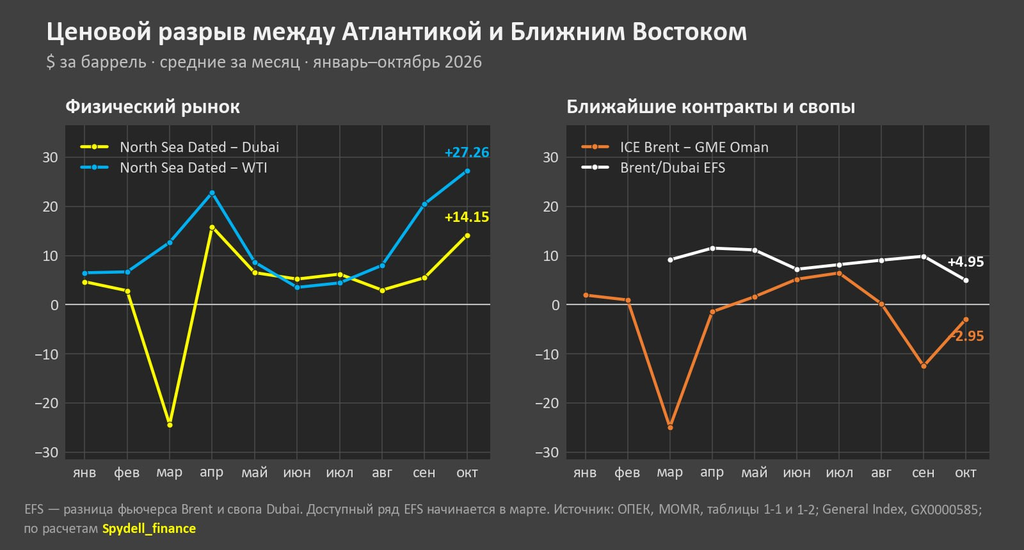
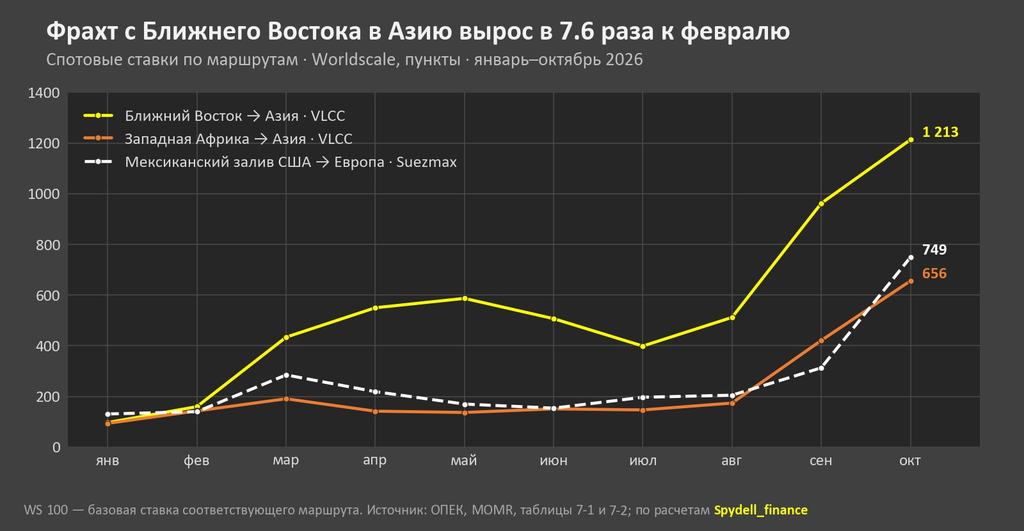
In the physical market, the premium changed sides as energy flows were rerouted. In OPEC’s quotations, North Sea Dated cost $24.41 per barrel less than Dubai in March, and in October it cost $14.15 more, a swing of $38.56 over seven months. Over September–October the spot premium of Dated over Dubai widened from $5.49 to $14.15, while the spread between the front-month Brent futures and the Dubai swap (EFS) narrowed from $9.85 to $4.95. From March to October, Murban moved from a discount to Dubai of $17.39 to a premium of $0.37, and Basrah Medium from a discount of $10.63 to a premium of $1.00. Shipping costs rose significantly. VLCC rates from the Middle East to Asia rose 26% from September to October, from West Africa to Asia by 56%, and Suezmax rates from the Gulf of Mexico to Europe rose 139% on the Worldscale scale, as longer voyages and rerouting increased tonnage demand. Tankers that Kpler classifies as elevated risk accounted for 21% of loadings in its sample, compared with about 5% before the war. OPEC estimates DoC oil demand for Q4 2026 at 43.55 million barrels per day, 2.32 million above October production in its table. These OPEC data are curious, suggesting the Hormuz crisis has been fully resolved, at least based on October data, which is surprising and unexpected.
Multimodal Tensor Model of Oil Price Evolution and Geopolitical Risk
The failure of Russia-Ukraine negotiations, as anticipated by the models, and the restoration of 81% of Middle East oil production constitute two orthogonal shocks: the first validates a bullish geopolitical channel (escalation risk premium), while the second activates a bearish logistical channel (return of physical supply). However, the scalar reading of the price (Brent around 90-105 /b) masks a profound dislocation. The application of the MMT Architecture reveals that the market does not price a weighted average but a fractal coexistence of opposing forces on distinct time horizons. The long position of 148 M$ (10x leverage) on Hyperliquid is not an irrational bet but a systemic hedge against the winter escalation scenario. The note details the decomposition of this tensor, identifies specification errors in linear models (OPEC vs. EIA), and proposes a PhD-level pricing framework for the next 90 days.
The T space of informational states is S = D_geo ⊗ D_log ⊗ D_mon ⊗ D_micro, and the spot price P_Brent(t) is the scalar contraction of this tensor, an operation that destroys information. The geopolitical channel (D_geo) sees the probability of a “Façade ceasefire” scenario collapse from π ≈ 0.35, while the “Winter escalation” scenario (π ≈ 0.45) is validated by the territorial status quo and Russian strikes on energy infrastructure. The geopolitical risk premium (PRG) on Brent remains anchored between +8 and +12 $/b, and the market no longer prices peace but the probability of a supply disruption via the Strait of Hormuz. The logistical channel (D_log) shows that the 5 Gulf countries have recovered 81% of their production (21.61 mb/d vs. 23.54 mb/d in February), with Iraq (+2.97 mb/d) and Saudi Arabia (+2.24 mb/d) driving the recovery, while Iran recedes (-0.37 mb/d) and the cumulative deficit since March reaches 1.57 billion barrels. Logistical frictions include an inversion of the Dated-Dubai differential (from -24,41 in March to +14,15 in October), a 26% rise in VLCC freight rates (Gulf -> Asia) in October, and a 139% rise in Suezmax (USG -> Europe). The monetary channel (D_mon) notes that SAMA (Saudi Arabia) Treasury sales of 142 M (1,1 Md/week) create upward pressure on US yields, and the probability of a Fed rate hike in December 2026 has risen to 70% (Polymarket/Kalshi consensus), reinforcing the gold debasement channel and the risk premium on oil. The microstructure channel (D_micro) identifies the long position of 148 M$ (10x, cross-margin) on BRENT OIL and CL, with liquidation prices at 86,47 $ (Brent) and 68,72 $ (WTI), as a costly signal. Maintaining this position despite a drawdown of 15 M$ indicates structural conviction on the escalation scenario; the risk is of a stop-hunting: if the market pushes Brent below 95, forced liquidation of this position (1.4 million notional barrels) would trigger a self-fulfilling bearish cascade.
Several source data inconsistencies must be corrected. The OPEC estimates a deficit of 4.16 mb/d in Q3 2026, while the EIA estimates a deficit of 1.20 mb/d, a colossal divergence of 2.95 mb/d explained by different methodologies (OPEC includes non-OECD countries, EIA focuses on OECD stocks); the model must use a Kalman filter to weight these sources. There is a “October Surplus Paradox”: a surplus of 1.69 mb/d in October but a cumulative deficit of 572 million barrels over March-October; global reserves have fallen by 537 million barrels (294 million outside the OECD), making the market structurally deficit and the October surplus a statistical artifact. The “Contournement Route Illusion” shows that shipments via Yanbu and Fujairah covered over 500 million barrels, but 2.8 billion were lost via the Strait; the bypass compensates only 18% of the logistical shock.
Quantitative projections use a Merton Jump-Diffusion model with jump intensities (λ) calibrated on prediction markets and diplomatic communiqué NLP data, resulting in a tensor pricing equation: P_Brent(t) = F_fundamental(t) + Π_geo(t) + Π_log(t) + Π_mon(t) + ϵ(t). The scenario matrix for T+90 includes: S1: Winter Escalation (π=0.45, Brent 115-130 $/b, very positive for the position); S2: Tense Status Quo (π=0.35, 98-108 $/b, neutral to positive); S3: Rapid De-escalation (π=0.20, 80-90 $/b, severe loss risk of liquidation below 86,47 $). The mathematical expectation of Brent at T+90 is E[P_Brent] = (0.45×122) + (0.35×10³) + (0.20×85) = 54.9 + 36.05 + 17 = 107.95 $/b, a bullish expectation but with high variance; the 148 M$ long position is statistically justified but its 10x structure is vulnerable to scenario S3.
The oil market in November 2026 is not incoherent but multi-dimensional; the restoration of Middle East supply (physical channel) is canceled by the failure of Ukrainian negotiations (geopolitical channel) and expensive freight (logistical channel). The spot price of 90-105 /b is the residue of a tensor where the war risk premium (≈ 10 $/b) and freight premium (≈ 15 $/b) compensate for the decline in fundamentals. The 148 M$ position is an informed bet on the persistence of this tensor. The final recommendation is a conditional GO for maintaining the long position, with a strict mandate to reduce leverage to 5x and immediate implementation of the NLP pipeline to anticipate diplomatic leaks; the 90-day target price is 108 $/b (95% confidence interval:).