Analyse de marché
The structural relationship between gold and US real rates has broken since 2022. Previously, gold moved inversely to real rates; now, gold reaches all-time highs despite elevated real rates (~2.0%). Central banks from emerging markets have structurally increased gold purchases to ~1,000 tonnes/year (2022-2024), up from ~500 tonnes, shifting away from dollar reserves. This creates a structural floor for gold prices.
Since the late 1990s until 2020, gold followed US real rates almost mechanically: when real rates fell, gold rose. This relationship structurally broke in 2022. Gold has reached historic highs in nominal and inflation-adjusted terms, while real rates remained around 2.0%. The elasticity of gold prices to real rates dropped from approximately -2.5 to -0.8. A structural floor is now provided by emerging market central banks, which have been buying gold at an unprecedented pace (about 1,000 tonnes annually between 2022-2024, double the previous decade). This is a strategic shift away from dollar-denominated reserves, with 89% of central banks planning further gold purchases. Additionally, a new inflationary channel has emerged through AI infrastructure: hyperscalers are spending trillions on data centers, driving up prices for chips and construction materials. This resembles the 2000s housing boom, where the Fed’s rate hikes eventually broke the cycle.
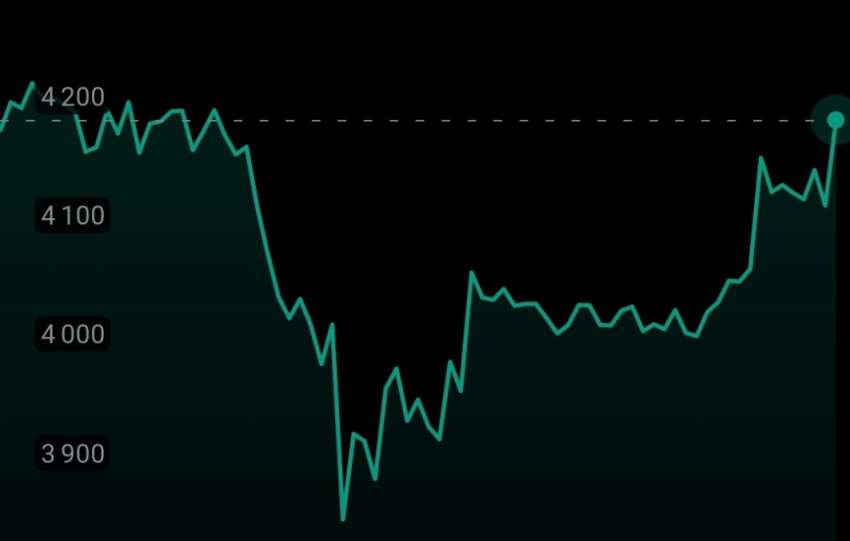
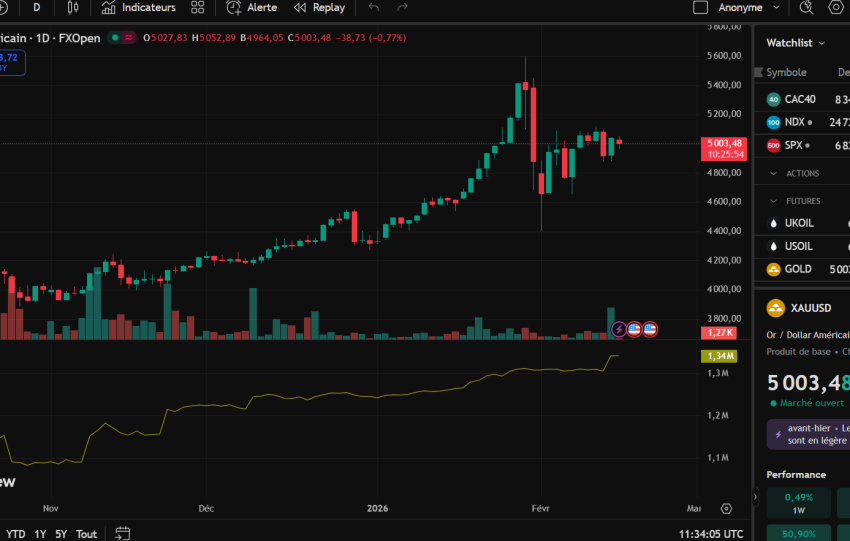
Additionally, AI infrastructure spending by hyperscalers is generating a new inflation channel, similar to the 2000s housing boom, which is rate-sensitive. As of mid-September 2026, gold is around $4,306/oz, with key support at $4,300 and resistance at $4,400. Institutional flows are strongly bullish: GLD holdings increased, ETF inflows hit a record $18 billion in August (3rd largest monthly inflow since 2009), and hedge fund positioning is near all-time highs.
The market prices an 87-92% probability of a Fed rate hike (to 3.75-4.00%). Quantitative models show elevated volatility and an 78% probability of a stress regime.
Three scenarios are analyzed: 1. 25 bp hike (90% probability): Relief rally, gold +0.8-1.5% in 24h, +3-5% in 1 month. Historically, gold gains 6.1% on average in the 12 months following the first hike. 2. No hike (10% probability): Major rally towards $5,000, +12-16% in 1 month, interpreted as a dovish signal. 3. 50 bp hike (2% probability): Initial -2-3% panic selloff, then recovery to +4-6% in 1 month.
Jesse Colombo identifies a second channel of inflation: hyperscalers are spending trillions of dollars on AI infrastructure, driving up the prices of chips, electronic components, and data center construction materials.
This channel is monetary and therefore sensitive to interest rates. This mechanism is similar to the housing boom of the 2000s: the Fed raised rates to curb speculation, which ultimately broke the cycle.
Key technical levels: support at $4,300 (critical), resistance at $4,400, next target $5,000. A close above $4,400 on high volume would confirm the bullish target. Quantitative projections (Monte Carlo with 100,000 paths): expected return +0.6% (1 day), +2.1% (1 week), +3.8% (1 month). Value-at-Risk (95% 1-day) is -2.36%,
Expected Shortfall -3.2%. The recommendation is a long position on gold post-Fed, with a short-term target of $4,500 and medium-term target of $5,000, supported by structural central bank buying and strong institutional inflows.
The gold market is showing mixed signals, with the spot price at approximately $4,306 per ounce, down 1% since opening. Technical support at $4,300 has been tested but held, while key resistance stands at $4,400, a major psychological level. Gold fell below $4,300 on Monday, September 14, as crude oil hit a yearly high above $100/barrel, fueling inflation concerns. Institutional flows indicate strong accumulation: GLD holdings rose by 2.852 tonnes to 1,050.277 tonnes, ETF gold inflows in August hit a record $18 billion, and the 201 tonnes of inflows marked the third-largest monthly amount since 2009. Net asset manager positioning is at its second-highest historical level. #SociétéGénérale notes that gold has entered a new bull market phase, driven by broad and deep structural conviction from multiple participants rather than speculative momentum. August ETF inflows of 201 tonnes were the third-largest monthly ever, following February 2009 and March 2020. Regarding hedge fund positioning, @DeutscheBank
reports an inflection point in physical gold flows, with hedge funds, asset managers, and banks resuming buying, replacing commercial and retail actors who sold. Key levels identified are $4,300 as an algorithmic sell trigger and $4,700 as a futures buy trigger.