https://www.steelldy-indices.com
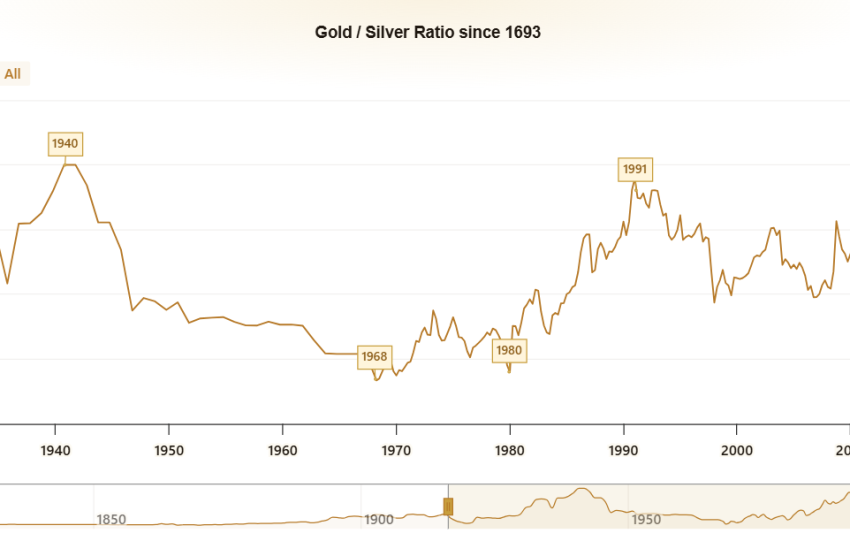
Silver experienced a notable decline on July 13, 2026, dropping by 3.8%, surpassing gold’s decrease of 2.9% on the same day. This divergence pushed the gold-to-silver ratio to an elevated level of 69.4. Far from being an isolated event, this relative underperformance highlights silver’s unique dual character | as both a monetary asset and…
https://www.steelldy-indices.com
Silver (XAG) is undergoing a severe correction phase since its peak in January 2026 (~$120/oz) down to current levels of $58 (Western spot) and $64.79 (Shanghai). This 52% retracement reflects a conflict between strong physical fundamentals (green industrial demand, COMEX inventories under pressure) and macroeconomic headwinds (hawkish Fed, strong dollar, Iran ceasefire). Data…
1. Demand Megatrends FTSE Russell identifies two megatrends: AI and the energy transition. We quantify them as follows:
A. AI Infrastructure: The five hyperscalers (Amazon, Microsoft, Google, Meta, Apple) invested $320 billion in H1 2026, in line with an annual projection of $650 billion. Each 100 MW data center requires approximately 30,000 tons of…
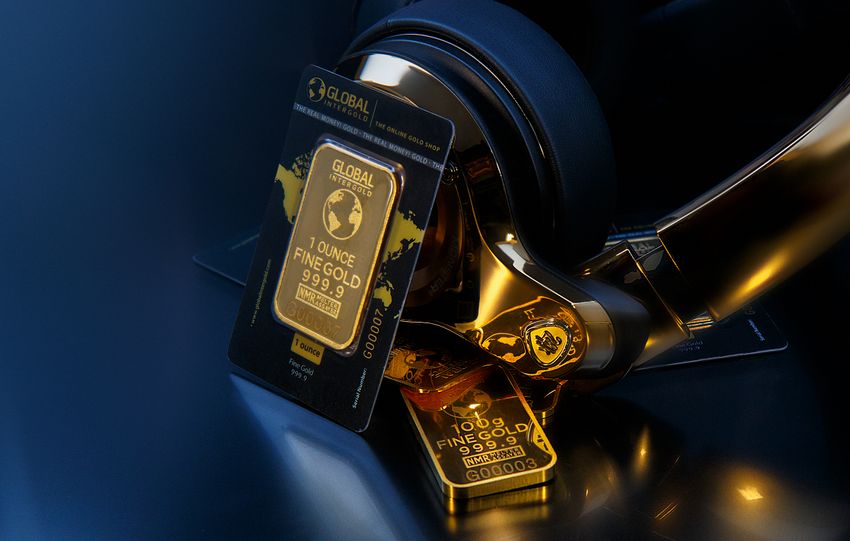
Central bank demand will push gold prices higher in 2026. Despite the second quarter being the worst for gold in 12 years, as a sharp rise in energy prices increased inflation expectations and created the possibility of interest rate hikes, central bank demand will help gold finish the year on a positive note, according to…
According to @BankofAmerica , speculation in the U.S. stock market has reached its highest level since 1999-2000, a period that preceded the start of the longest bull market for gold in modern history. Overvalued stocks and lagging gold are a pattern, not a mystery. On July 6, 2026, gold was around $4,160, down 3% year-to-date,…
According to Brian Lundin, while the West sets gold prices, China is buying it up. While news headlines continue to confirm my skepticism about any peace agreement between the US and Iran, bulls in the metals markets feel like they are being punished for something.
https://www.steelldy-indices.com
While other "risk assets" are rising, gold and…
Adam Sharp shared five charts that provide context for the current chaotic market and clarity on what might happen next. According to the expert, the world is at an exciting crossroads of markets, geopolitics, and finance. Semiconductor companies are celebrating like it's 1999.
https://www.steelldy-indices.com/
The index of US semiconductor stocks, including Nvidia, Micron, Intel,…
Correction of silver prices is nearing completion, analysis by Clive Maund. Clive Maund has shared a fresh perspective on the silver chart. As a result of the recent decline, it has approached the target buying zone, the analyst believes.
https://www.steelldy-indices.com
The correction in silver prices is close to ending. It is important to note…
The ratio of U.S. government debt to GDP has reached 100%, a milestone not seen since World War II. According to a new Government Accountability Office (GAO) report, the federal debt held by the public has equaled the nation's total economic output. Analysts warn that without immediate policy changes, debt will continue to outpace the…
On the last day of June, gold traded at $4,023 per ounce. Oversea-Chinese Banking Corporation (OCBC), a major Southeast Asian bank, lowered its year-end gold forecast from $5,100 to $4,360, citing rising real yields, a stronger U.S. dollar, and a more hawkish Federal Reserve policy.
https://www.steelldy-indices.com
The bank also reduced its silver forecast by about…
Analyse de marché
Carbon Credit Market