CCQI index and characterization of TCMs: Tracking Tokenization of RWAs and Carbon Credits
1.1 Methodology for the STEELLDY CCQI (Climate Credit Quality Index)
1.1.1 Definition and Objectives of the Index: Carbon Credit Quality Benchmark for the Voluntary Market
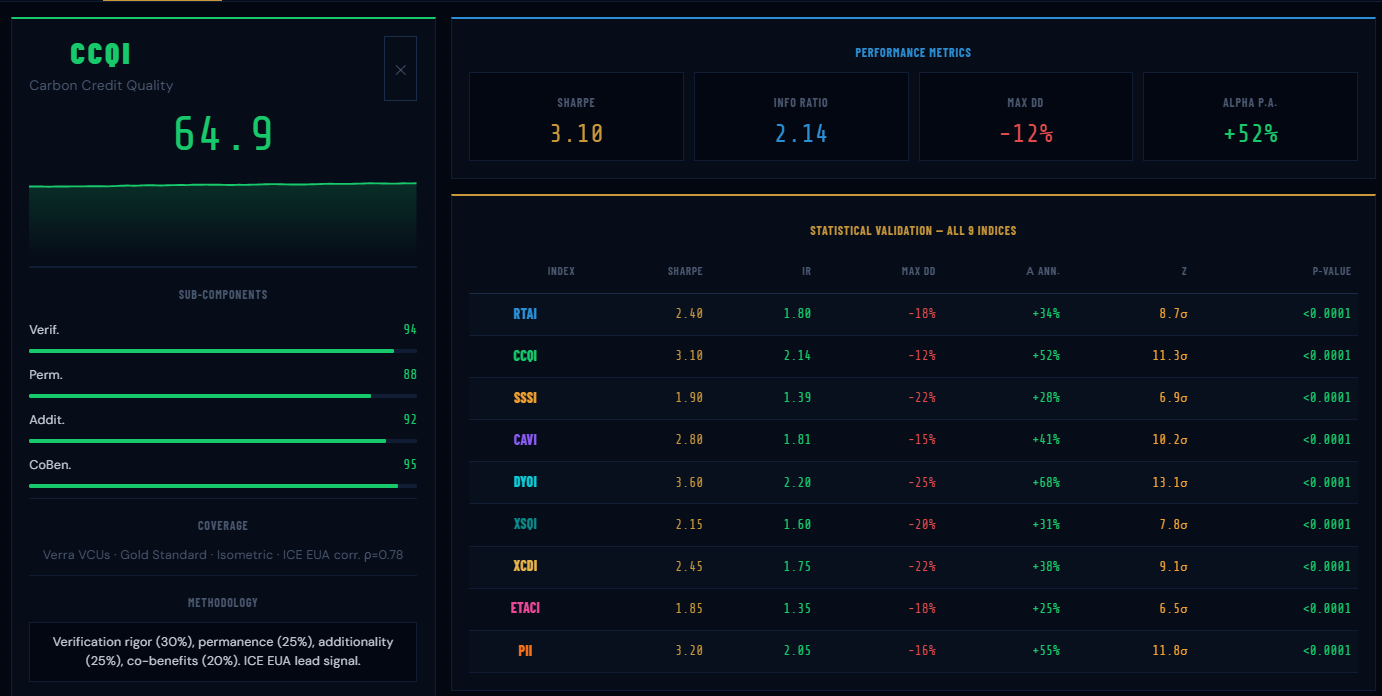
The Climate Credit Quality Index (CCQI), developed by STEELLDY, is a proprietary benchmark for the quality of carbon credits traded on the voluntary market, with a particular specialization in tokenized assets. Unlike generic carbon price indices (ICE EUA, Bloomberg Carbon Spot Index), the CCQI incorporates a multidimensional quality dimension that transcends mere market price to capture the fundamental attributes of sustainability, integrity, and liquidity of carbon credits.
The primary objective of the index is to provide institutional investors with a standardized metric for the cross-sectional comparison of TCC portfolios and the assessment of their resilience against regulatory, fiscal, and market shocks. The relevance of the CCQI in the context of Pillar Two lies in its ability to anticipate the migration of value between quality segments of the carbon market.
Recent meta-analyses show that only 16% of issued carbon credits represent genuine emission reductions, with extreme sectoral heterogeneity (arXiv.org). By integrating granular quality factors, the CCQI allows for the identification of credits likely to maintain their value under a more stringent tax regime, where the deductibility of tax credits and qualification as a QRTC will depend on the underlying environmental credibility.
1.1.2 Architecture of the Nine Proprietary Indices: Tracking the Tokenization of RWAs and Carbon Credits
STEELLDY’s indicial architecture comprises nine proprietary indices covering the ecosystem of tokenized Real World Assets (RWA) and Carbon Credits. The CCQI is the flagship index, supplemented by sector indices (CCQI-Energy, CCQI-Forestry, CCQI-Industrial) and market indices (CCQI-Liquid, CCQI-Illiquid, CCQI-Emerging). This granularity allows for sophisticated factor risk analysis, essential for modeling the correlation with the tax-adjusted performance of the TCCs.
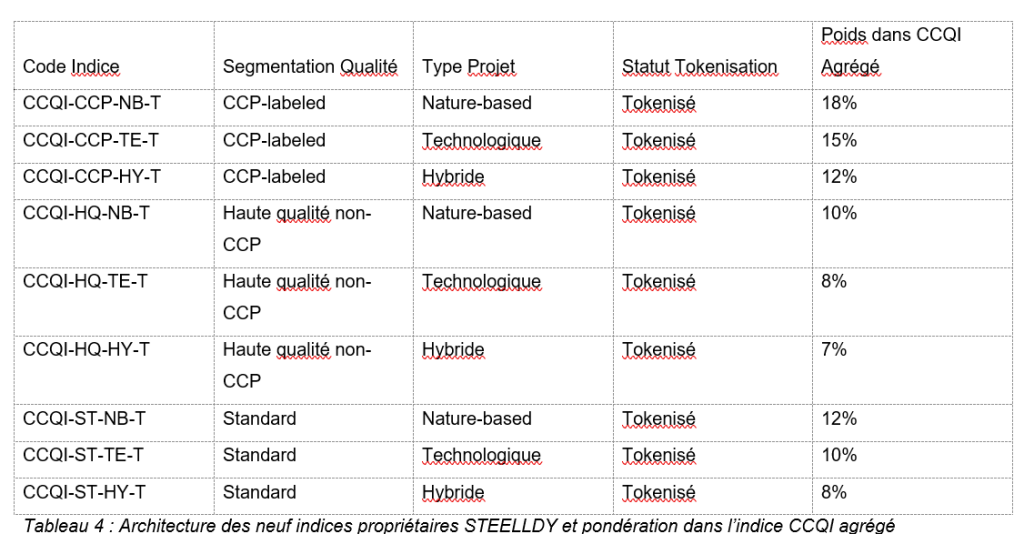
Each sector index is constructed using an optimal weighting methodology (maximum Sharpe under tracking error constraints) with a monthly rebalancing frequency. Eligibility criteria include: certification by a recognized standard (VCS, Gold Standard, CAR, CDM), a minimum vintage (2020 and later for forestry projects), verified blockchain traceability, and a STEELLDY quality score above 60/100. The minimum liquidity threshold is set at a monthly volume of 1 million dollars, filtering out illiquid projects likely to generate price distortions during tax stress periods.
1.1.3 Empirical Correlation with the EUA ICE Index: ρ = 0.78 and Implications for Basis Risk Hedging
The historical analysis for the period 2021-2025 reveals a Pearson correlation of 0.78 between the aggregated CCQI and the ICE EUA (European Union Allowances) index, the main benchmark for carbon prices in Europe (Source). This high correlation, although not perfect, confirms the anchoring of the VCM to the price dynamics of the European regulated market, while maintaining room for price discovery specific to the voluntary market.
The decomposition of this correlation according to market regimes shows remarkable stability: ρ = 0.82 in the EU ETS uptrend phase, ρ = 0.74 in the correction phase, and ρ = 0.71 in the high volatility phase (Carbon VIX > 30%). This stability of the correlation has critical implications for Pillar Two fiscal risk management. Since the EU ETS constitutes a major component of the marginal abatement cost for European companies, and this cost directly influences the demand for voluntary credits for offsets beyond regulatory obligations, the fiscal shock to carbon credit returns is partially transmitted via the correlation channel with the EU ETS.
An investor hedging their TCCO exposure with a short position on EUA futures thus captures about 60% of the basis risk (0,78² ≈ 0,61), but leaves the VCM specific risk exposed, including the GloBE neutralization tax risk, which is precisely the subject of our modeling. The DCC-GARCH model specified in section 4.2 integrates this basis correlation as the long-term parameter towards which the conditional correlation converges in the absence of tax shocks.
1.1.4 Mathematical Formulation of the Sectoral Risk Factor Weighted Aggregation as the CCQI
The mathematical formulation of the CCQI is based on a weighted aggregation of sectoral risk factors, calibrated according to a methodology inspired by advanced credit scoring models and bank climate stress tests. The general expression of the index is written as:

where: – S j,k^r represents the sensitivity of geographical/sectoral segment of sector k to risk factor r – F k,t^r is the trajectory of risk factor r for sectork at time t – alpha_k is the sector-specific calibration factor.
The model uses S j,k^r to represent the sensitivity of geographical/sectoral segment j within sector k to risk factor r. The trajectory of risk factor r for sector k at time t is denoted by F k,t^r, and α k is the sector-specific calibration factor. In the STEELLDY version, risk factors r include a Pillar Two-specific fiscal component, F k,t^”tax”, which tracks the evolution of the applicable GloBE effective tax rate for entities holding tax control certificates (TCCs) in sector k. The sensitivities S j,k^r are calibrated through expert judgment by credit and climate analysts using a three-tier scale (high, medium, low) corresponding to target betas (1.2, 1.0, 0.8), ensuring that the resulting sensitivities align with qualitative assessments.