The gradual shift of the XRP Ledger (XRPL) from a simple payment network to a true institutional settlement layer (RWA, tokenization, interbank cross-border settlements) is empirically observable.
J.P Morgan recently revealed its utilization of the XRPL.✅ Up next? 🙇♂️ Goldman Sachs and Citi.😏💨 https://t.co/nCu062uXxz — SMQKE (@SMQKEDQG) May 9, 2026
Quantitative Validation Elements …

The impact of the Pillar Two international tax regime (OECD) on the valuation and structuring of tokenized carbon credit (TCC) investments, particularly in France.
(A) Structural effect of Pillar Two on the taxation of TCCs
¤ Pillar Two imposes a minimum effective rate of 15% on the profits of multinational corporations, neutralizing tax optimization…
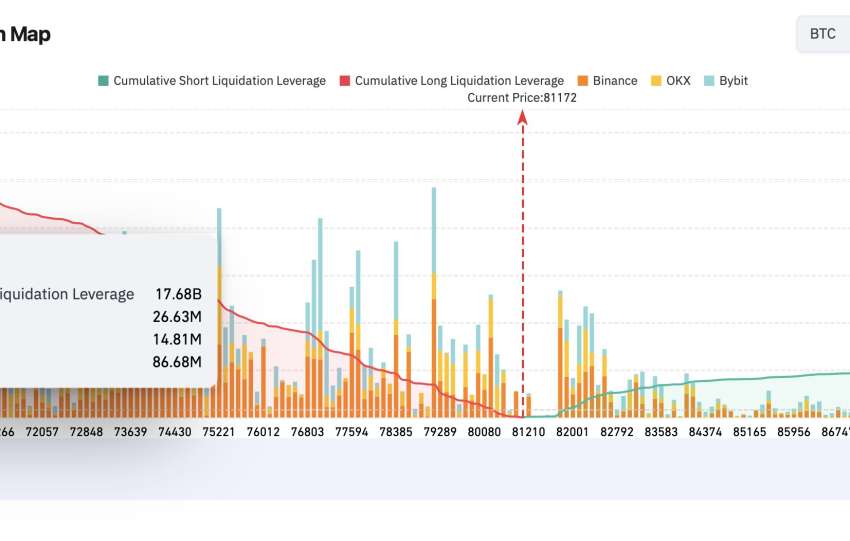
Central Thesis: The integration of Coinglass Liquidation Map data, the 3D rising wedge pattern, and BTC/Stablecoins dominance reveals that BTC has climbed towards 81,800 USD based on 17.68 billion in vulnerable long leveraged positions below current levels. This configuration, superimposed on the geometry of the 3D rising wedge (mechanical target 67,500-70,000 USD in case of…
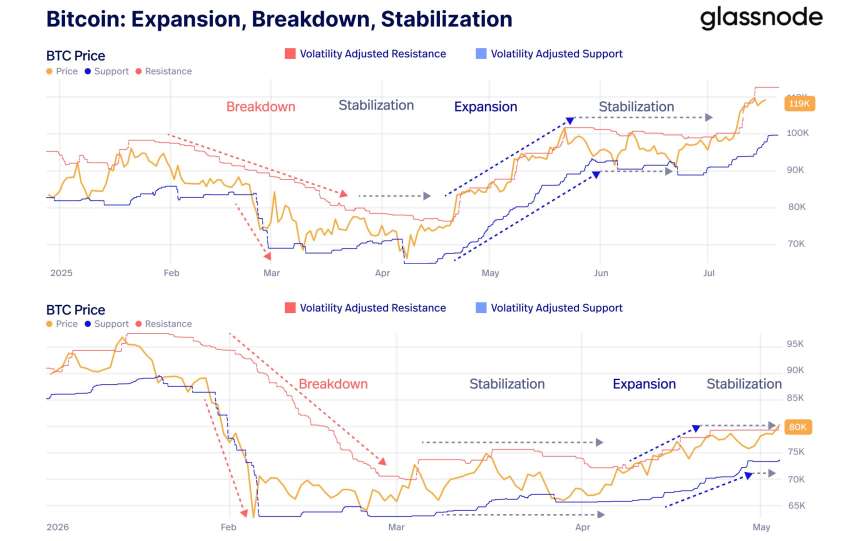
The Glassnode "Expansion, Breakdown, Stabilization" framework identifies a mature stabilization phase with volatility-adjusted support built around ~$74,000 and confluent resistance at $80,000–$83,000. This $78K–$83K zone constitutes the "Breakeven Battlefield" where the following overlap: (i) the STH Cost Basis at $78,700 (v5.0), (ii) the True Market Mean Price at ~$81,500 (v3.0), and (iii) the ETF Cost…
Visual Data
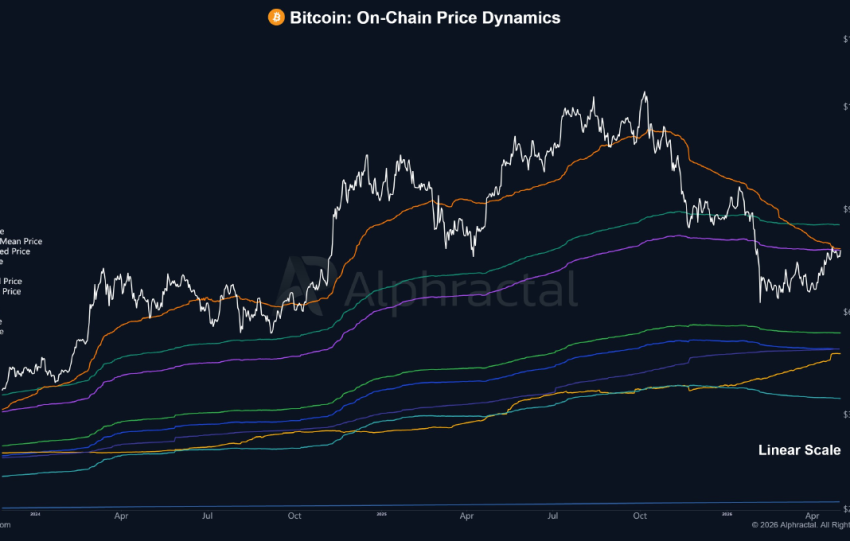
Red arrow: resistance cluster at $78,000–$80,000 (confluence of Realized Price, True Market Mean Price, Active Realized Price, Investor Price, STH Realized Price).
Green arrow: structural support cluster at $45,000–$50,000 (LTH Realized Price, CVDD, Delta Price, Average Price). The current price is positioned at the level of the red arrow, testing the…
The distinction between a "trap" and a "trigger" in market analysis centers on their nature, observability, agents involved, and timing.
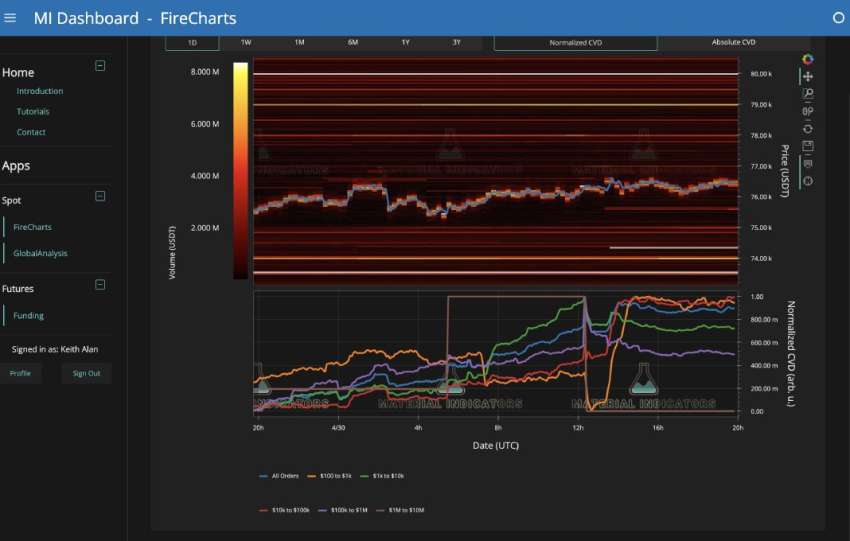
A trap is a static liquidity configuration, often visible in liquidity heatmaps as bid clusters (e.g., 76K–80K), indicating passive retail accumulation and suggesting resistance (high Kyle's Lambda). This configuration can take hours or days…
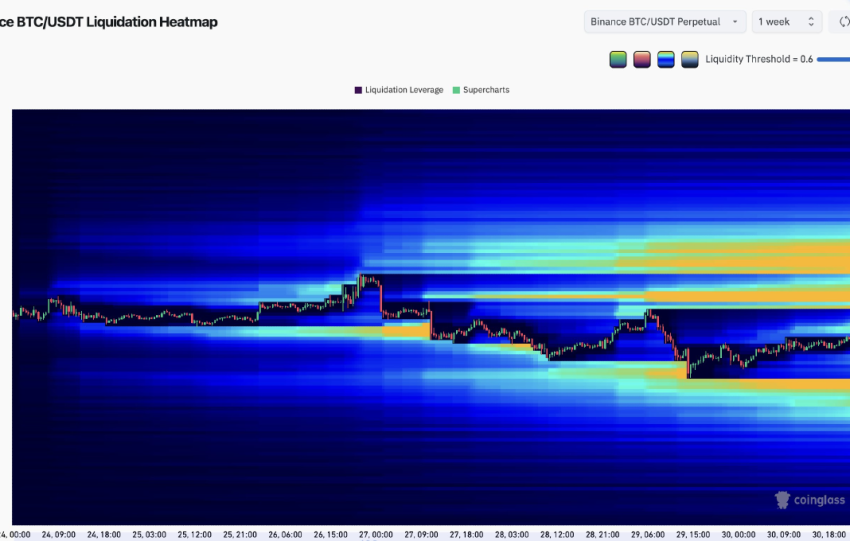
Visual Data: Liquidation density concentrated at $75,000 (long cluster) and $80,000–$85,000 (short clusters). 1-week heatmap showing yellow/orange bands (high density) at 75K and 81K+. Current price in a "blue" area (low density), i.e., compression zone.
Correlation with the April 30th study:
The April 30th study modeled a bimodal distribution of liquidations:
Mode…
L'année 2025 marque une accélération de la convergence des mégaforces, générant des opportunités et des risques non-linéaires. L'Intelligence Artificielle (IA) devient contrainte par son infrastructure matérielle et énergétique. Cela dicte trois axes d'investissement cruciaux : (i) l'extension de la chaîne de valeur de l'IA en amont vers les besoins en commodités numériques (tokens de calcul)…
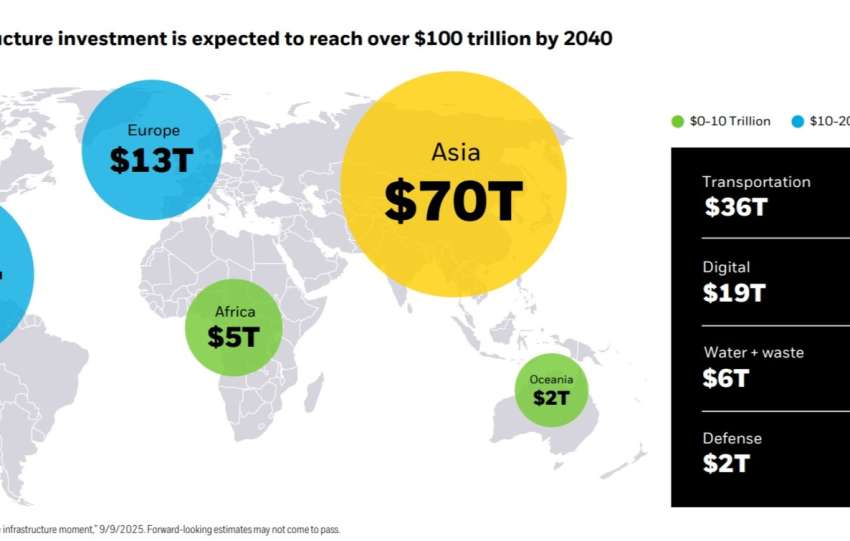
L'analyse de la période d'investissement 2025-2040, utilisant les projections de McKinsey et nos modèles Steelldy révèle une rupture structurelle dans l'allocation du capital mondial. Un besoin cumulé de 106 billions de dollars est identifié, traduisant une refonte majeure de l'outil productif global nécessaire pour soutenir la transition énergétique, l'essor de la demande numérique (IA) et…
SYNTHÈSE EXÉCUTIVE L'émergence des equities tokenisées sur blockchain représente une transformation structurelle des marchés de capitaux comparable à l'avènement du trading électronique dans les années 1990. Cet article examine l'effet de la tokenisation sur la liquidité et l'efficience des marchés, ainsi que les conséquences stratégiques pour les gestionnaires d'actifs institutionnels.
Conclusion principale. La tokenisation crée un marché parallèle…
Analyse de marché