Skip to content Skip to sidebar Skip to footer

Analyse de marché

Analyse de marché

Toute l'actualité de la finance et des marchés (Banques, assurances, gestion d'actifs, M&A, matières premières...). Vidéos, analyses, commentaires et interviews.

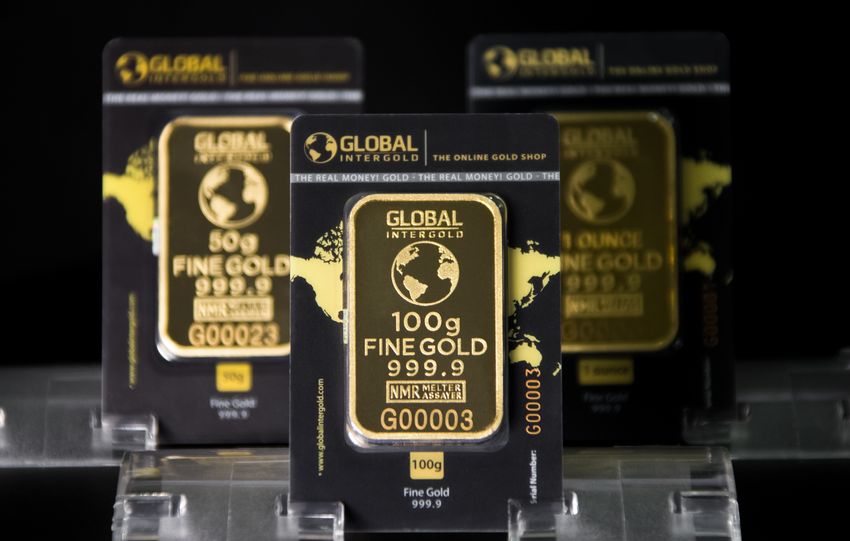
Focused image of 100g Intergold bars showcasing fine gold quality and luxury.

Gold’s +125% Surge Since 2023 Defies Rate Hikes: Fed’s First 2026 Increase Triggers “Buy the Fact” Rebound Toward $4,344

Summary. Quantitative Analysis of Gold Performance (+123% Since September 2023) and 2026-2027 Projections Post-Fed Decision A. Executive Summary. Gold spot price (Sept 18, 2026): $4,344.67, consolidating post-Fed. - Performance since Sept 2023: +125%, indicating a structural bull market. - Fed decision (Sept 16, 2026): Raised rates by 25 bps to 3.75-4.00%, the first hike since…
Read more

Stock market and financial analysis setup with calculator, graphs, and gold coins.

Why Gold Is Hitting Record Highs Despite Higher Interest Rates

The structural relationship between gold and US real rates has broken since 2022. Previously, gold moved inversely to real rates; now, gold reaches all-time highs despite elevated real rates (~2.0%). Central banks from emerging markets have structurally increased gold purchases to ~1,000 tonnes/year (2022-2024), up from ~500 tonnes, shifting away from dollar reserves. This creates…

Read more

Detailed view of brown coffee beans being roasted in a steel machine, capturing the industrial process.

Commodities & ESG taxonomy: real returns in a world of real assets

Thesis. Raw materials are regaining a core portfolio role (hedging a multipolar world and AI electrification), while European ESG shifts from an obligation-based regime to a market-driven one, less reporting, more pricing. Key Data. January 2026 records: gold ~$5,405/oz (2025 annual average: $3,431, +44%), silver >$121/oz, LME copper $13,238/t. Citi scenarios (Q3 2026): Brent…

Read more

Analyzing financial charts with a calculator and chocolate coins.

Gold  against stocks

Gold was indeed a high-Sharpe asset during certain windows from 2025 to early 2026, and long-term bonds did under perform. However, as of September 7, 2026, gold does not "beat tech stocks" over 12 months. NVDA and the S&P have higher TTM returns than those shown in the table. The illustrative recalibration (TTM window,…

Read more

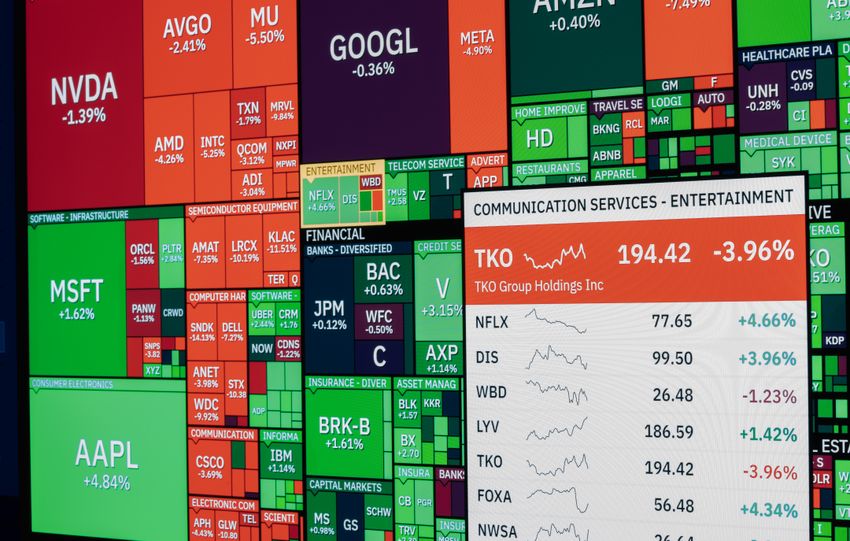
Colorful stock market board displaying various company stock performances and trends.

The Perfect Storm: Oil’s Spike, Japan’s Debt Shock, and Nvidia’s Quiet Bond Exit

Oil prices surged sharply after the US announced new strikes on southern Iran. Brent crude exceeded $92 per barrel, while WTI approached $90. Yields on 30-year Japanese government bonds (JGBs) surpassed 4.18%, and Nvidia exited the corporate bond market. How does this affect gold? Several explosions were reported near Bandar Abbas, Qeshm, and the Strait…

Read more

An elegant setup with a notebook, pen, and gold bar, embodying luxury and style.

Rising Demand for Direct Ownership of Physical Gold

The Financial Times reports a marked shift among wealthy investors toward direct ownership of physical gold and secure, individually allocated storage. In 2026, purchases by this group have surged to record levels, signaling a retreat from electronic exposure in favor of tangible assets. Industry observers highlight capacity constraints across premier vault facilities. London dealer Sharps…

Read more

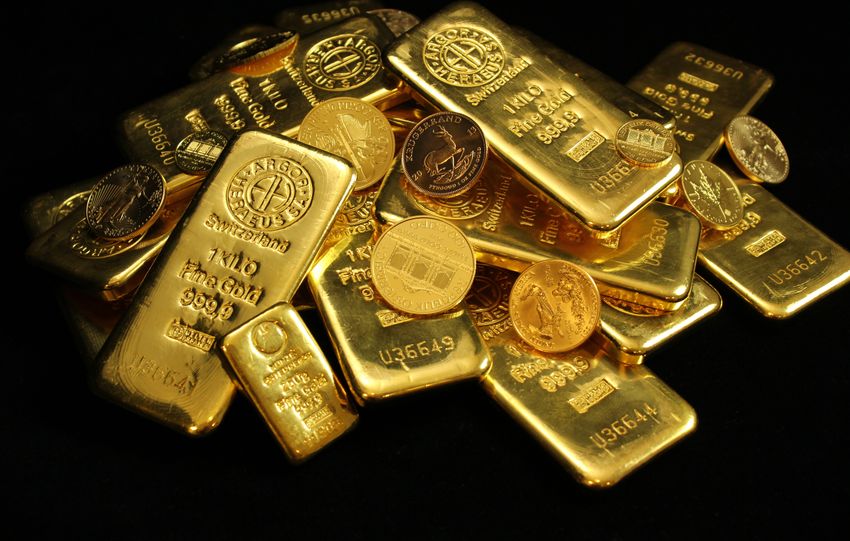
A collection of shining gold bars and coins symbolizing wealth and investment.

Structural Shifts in Central Bank Demand Are Redefining Gold’s Support Levels

According to Société Générale, the time has come to view gold optimistically again, as they observe a gradual recovery after months of correction. In a recent market assessment, analysts stated the precious metal looks attractive again, despite trimming their gold positions in the first half of the year. Gold recently rebounded to around $2,450 after…

Read more