Skip to content Skip to sidebar Skip to footer

Analyse de marché

Analyse de marché

Toute l'actualité de la finance et des marchés (Banques, assurances, gestion d'actifs, M&A, matières premières...). Vidéos, analyses, commentaires et interviews.

ScoreGex, la révolution des AVM (Automated Valuation Models)

Le marché mondial de l'immobilier représente 435 000 milliards USD en 2026, soit 66 % des actifs mondiaux (Global Real Estate = $435T, Global Bonds = $155T, Global Stocks = $130T, M2 = $105T, Gold = $37T, Crypto = $2.7T). La France, avec un parc immobilier valorisé à environ 12 000 milliards EUR, constitue le deuxième marché européen. ScoreGex.com se positionne…

Read more

Gold coins scattered with a stock market graph and a percentage symbol on an orange background.

Why Gold’s Low Sharpe Ratio Masks Its True Value as a Strategic Tail-Risk Hedge

Gold (Sharpe 0.4-0.7, Volatility 12-15%) acts as a reserve asset, inversely correlated with the DXY. Its low Sharpe ratio is due to no carry yield and custody costs, but it offers absolute decorrelation during systemic geopolitical shocks. Physical gold is now central to monetary influence wars (BIS Basel 2024-2025). Steelldy Engine 3.8 and Planet Labs…

Read more

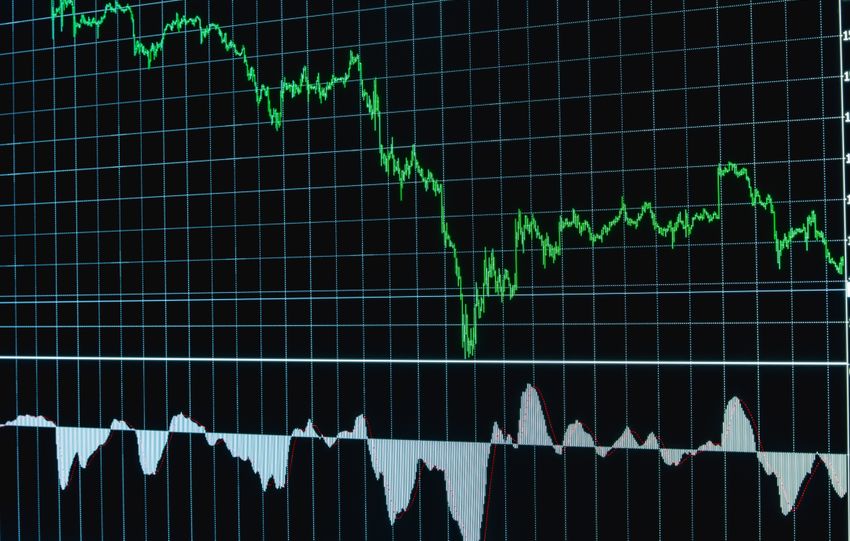
Detailed financial chart showing a downward trend, ideal for economics and stock market analysis.

The Monte Carlo analysis of JPY carry trade

The Monte Carlo analysis of JPY carry trade unwind uses a Merton Jump-Diffusion model to simulate USD/JPY dynamics over a 90-day horizon, capturing both continuous exchange rate movements and sudden discontinuities from forced position closures. The model incorporates calibrated parameters including a spot rate of 158.5, stressed volatility ranging from 9% to 18%, and jump…

Read more

Abstract view of a subway tunnel with motion blur and light streaks.

Global Systemic Convergence of the 7 Vectors (December 2025). Reassessment and Recalibration as of August 10, 2026

The original thesis from December 6-13, 2025, predicting a catastrophic systemic event driven by a Fed-BOJ shock and a $11.5 trillion carry trade unwind within 90 days, was not validated in its magnitude or timing. Observed reality shows USD/JPY peaked around 164 in late July 2026 after coordinated intervention, now near 158. The BOJ hiked…

Read more

Intricate futuristic circuit board with geometric patterns in teal and gray tones.

Profitability and margin structure. Quantified comparison of SpaceX (Q2 2026) vs hyperscaler models (AWS, Azure/Microsoft Cloud, Google Cloud, Meta AI infrastructure).

https://www.steelldy-indices.com SpaceX has a gross margin of 55.3%, but negative operating and net margins (-1.8% and -6.9%). Only Starlink connectivity is profitable (~+$1.66B OI), while Space and AI segments are loss-making. AWS boasts a 39.4% operating margin (+650 bps YoY), generating ~60% of Amazon's consolidated OI from ~21% of revenue. Microsoft Cloud's gross margin is…

Read more