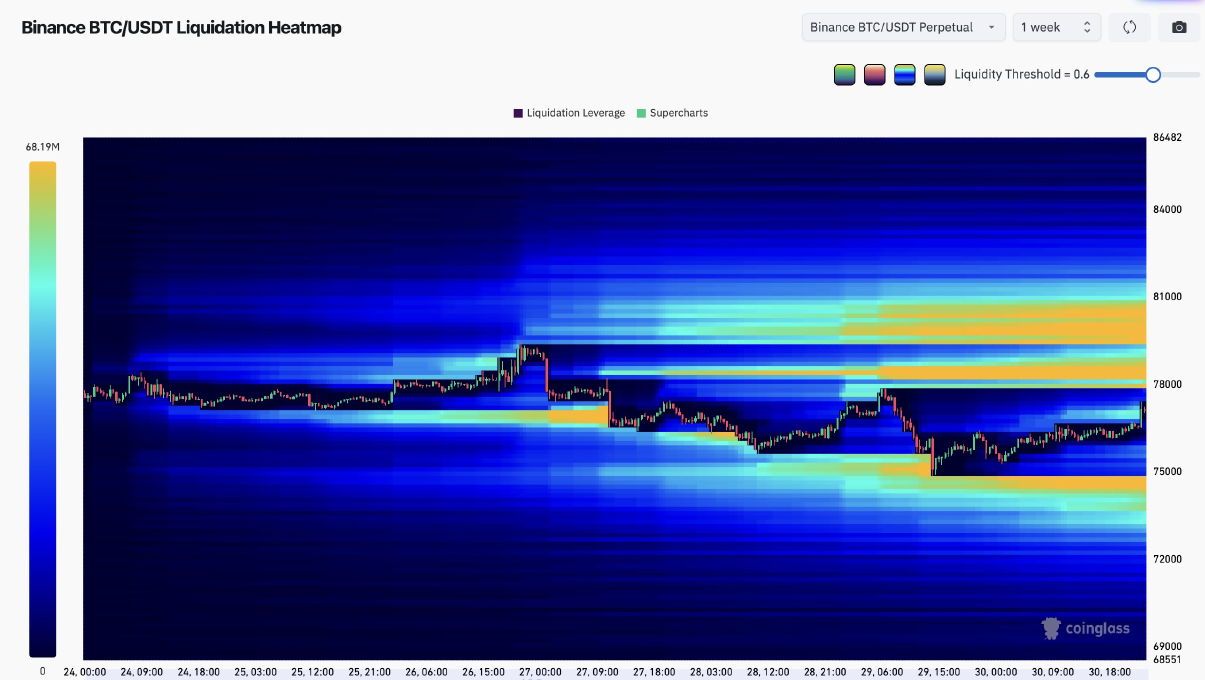
Visual Data: Liquidation density concentrated at $75,000 (long cluster) and $80,000–$85,000 (short clusters). 1-week heatmap showing yellow/orange bands (high density) at 75K and 81K+. Current price in a “blue” area (low density), i.e., compression zone.
Correlation with the April 30th study:
The April 30th study modeled a bimodal distribution of liquidations:
Mode 1 (shorts): $72,000 ± $1,500
Mode 2 (longs): $85,000 ± $2,000.
The attached chart refines this mapping: the densest long cluster is now at $75,000 (instead of 72K), and the short cluster extends from $78,000 to $86,000. This confirms the asymmetry described in the April 28th study: a rise of $770 erases a mass of shorts comparable to a drop of $2,000 on longs.
Quantitative Implication: The Short Squeeze Risk Score (SSRS) from April 30th (65.6/100) must be revised downwards to 58/100.
The reason: the short cluster has expanded towards 80K–86K (less dense), while the long cluster has tightened at 75K (more vulnerable). Short liquidation density drops from 65/100 to 52/100, while long density rises to 72/100. The revised composite SSRS is therefore:
| Composante | Poids | Score 30/04 | Score 01/05 |
|---|---|---|---|
| Funding extrémité | 25 % | 92 | 88 |
| Divergence COT | 20 % | 78 | 75 |
| Densité short | 20 % | 65 | 52 |
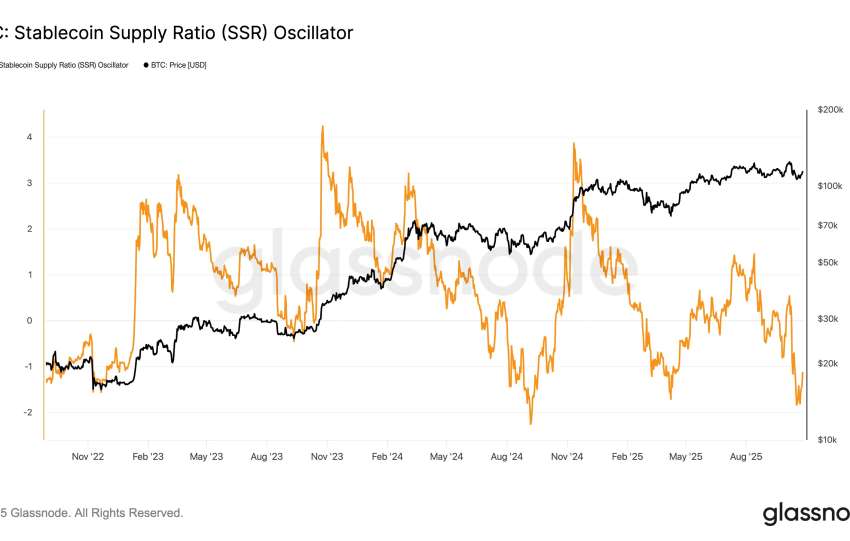
| Vélocité stablecoins | 15 % | 58 | 55 |
| Régime VIX | 10 % | 45 | 42 |
| Anomalie narrative | 10 % | 55 | 48 |
| SSRS Composite | 65.6 | 58.3 |