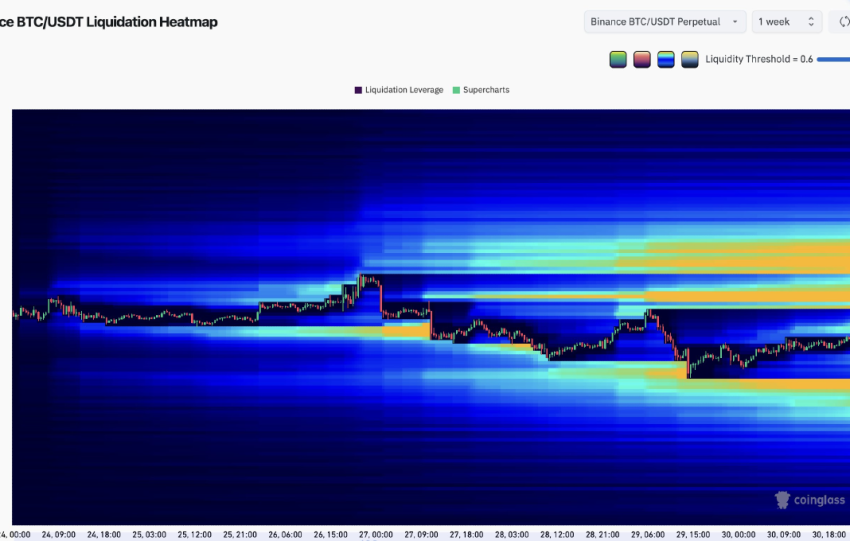
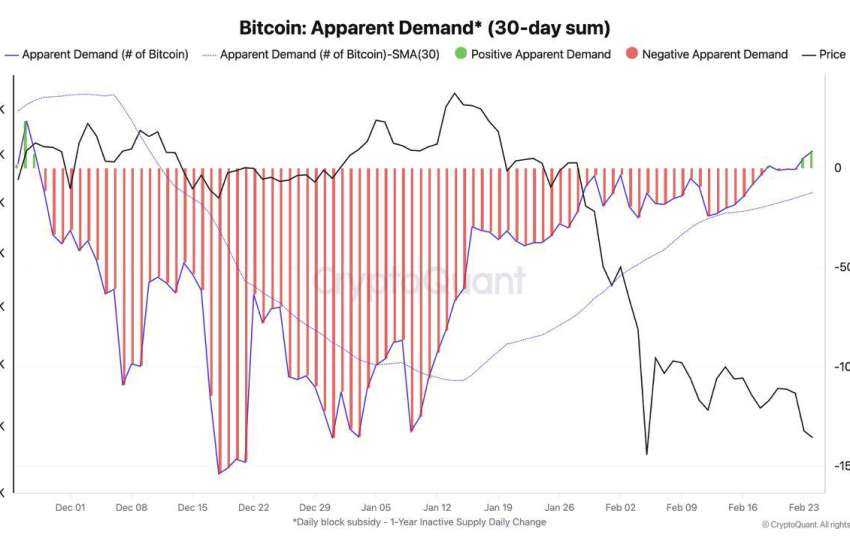
Central Thesis: The integration of Coinglass Liquidation Map data, the 3D rising wedge pattern, and BTC/Stablecoins dominance reveals that BTC has climbed towards 81,800 USD based on 17.68 billion in vulnerable long leveraged positions below current levels. This configuration, superimposed on the geometry of the 3D rising wedge (mechanical target 67,500-70,000 USD in case of…
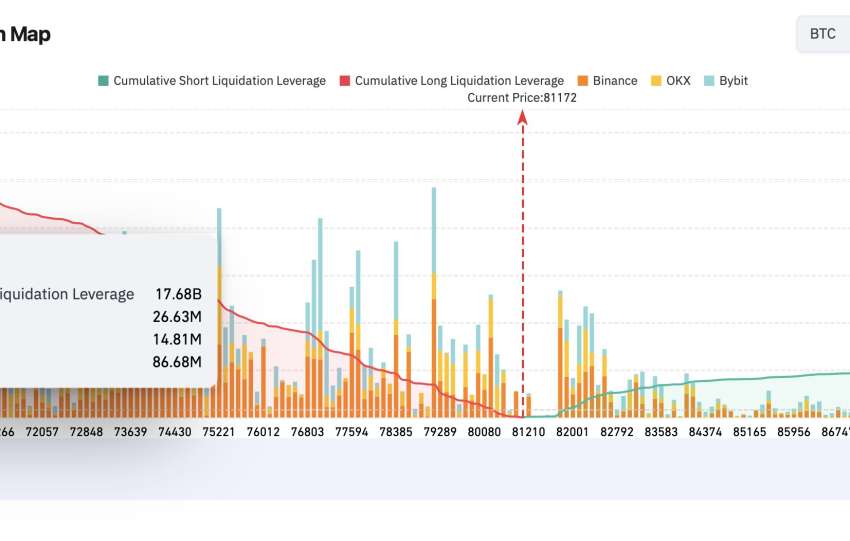
Visual Data: Liquidation density concentrated at $75,000 (long cluster) and $80,000–$85,000 (short clusters). 1-week heatmap showing yellow/orange bands (high density) at 75K and 81K+. Current price in a "blue" area (low density), i.e., compression zone.
Correlation with the April 30th study:
The April 30th study modeled a bimodal distribution of liquidations:
Mode…
Le Bitcoin évolue actuellement dans une structure de compression de volatilité (Squeeze) centrée sur le niveau de support microstructurel des 67 144 USD. Notre moteur de calcul intégré identifie une anomalie de liquidité : un déséquilibre flagrant entre l'absorption institutionnelle (Spot ETF) et la capitulation du levier retail (Perpetuals). La tendance est dictée par la…