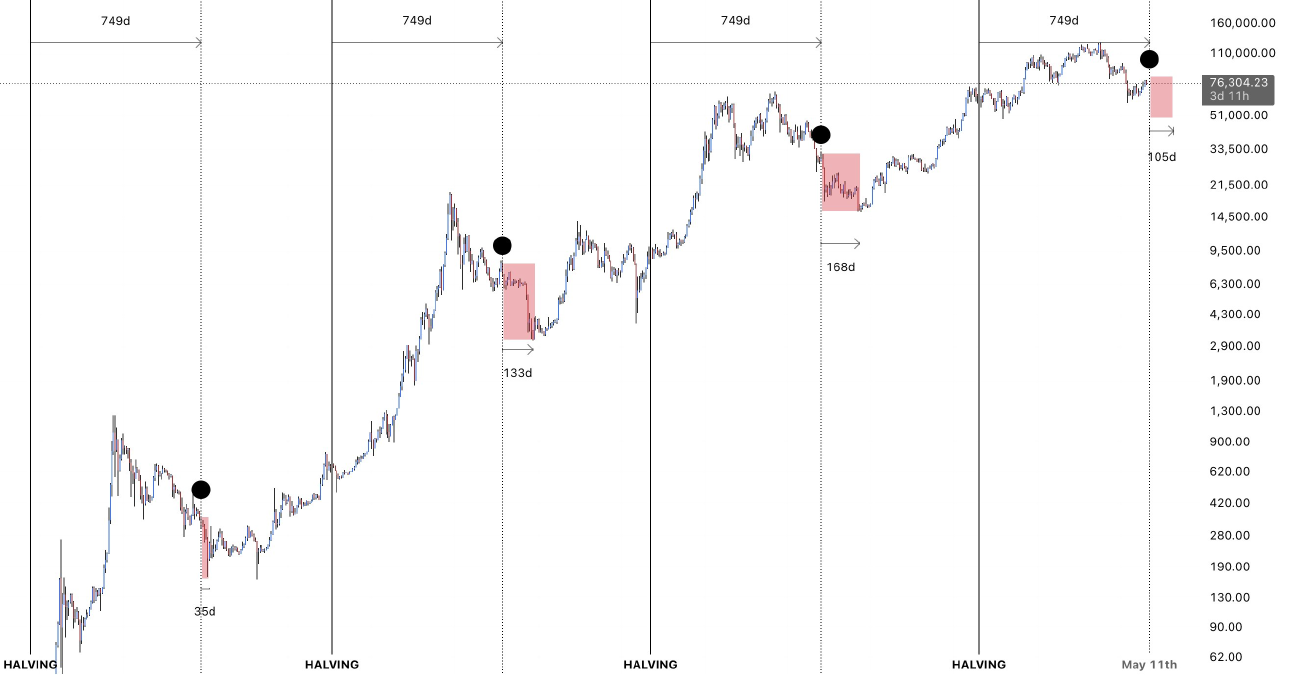
Visual data: ~750 days after each halving mark a cyclical top.
Subsequent capitulation period: 100–170 days. We are at ~750 days since the April 2024 halving.
Correlation with our previous macro studies: The April 28 study postulated a structural decoupling of BTC/NASDAQ with a negative correlation (–0.42). The April 30 study incorporated the FOMC 6/6 dumps pattern. The attached chart adds a cyclical time constraint: if the October 2025 top (~USD 126,000) were the peak of the 2024–2028 cycle, we are entering the historical capitulation phase.
Quantitative implication: The A.-G. model with FOMC jumps from the April 30 study projected a dump of –9% to –14% post-FOMC. The attached chart suggests this dump might only be the beginning of a 3–5 month capitulation. The technical target of USD 68,200 (April 30 study) would then be an intermediate bounce, not the final bottom. The cyclical bottom, based on halving timing, could be situated between USD 50,000 and USD 59,000 by August–October 2026.