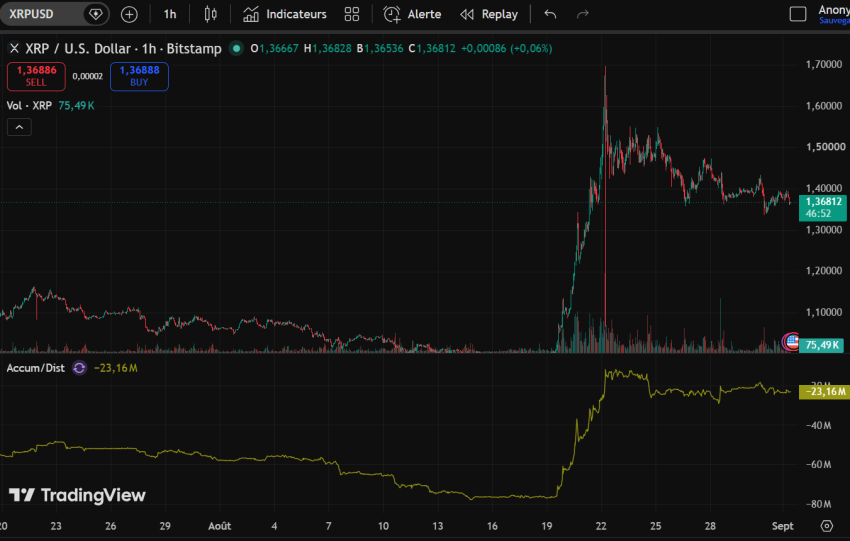
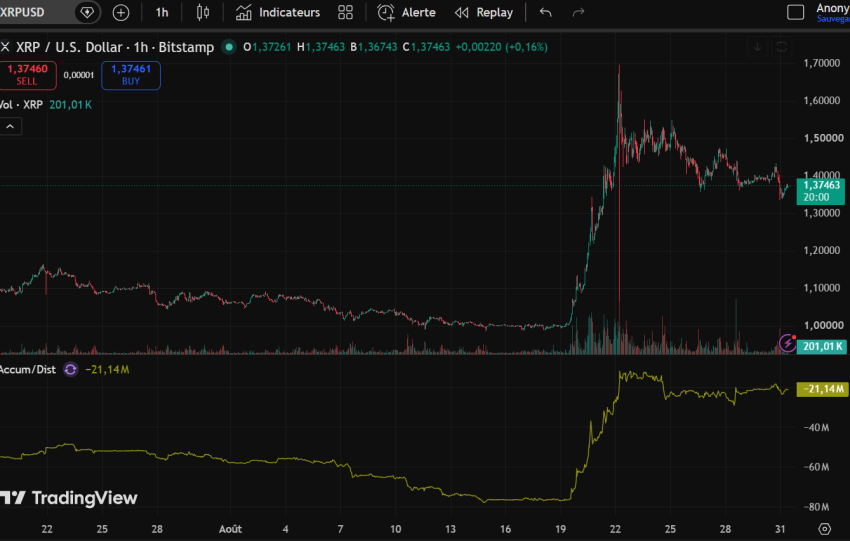
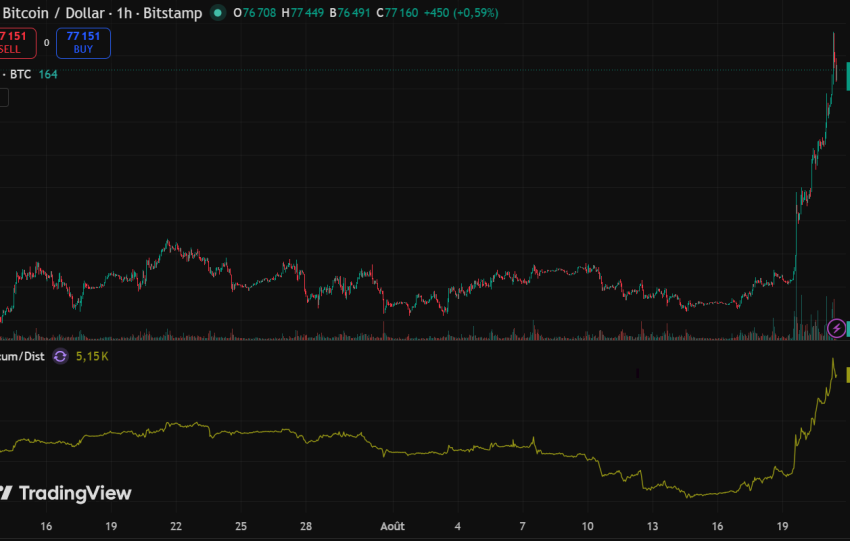
As of September 11, 2026, the crypto market presents a mixed macro regime. Bitcoin trades near $77,200–77,400, showing a -4.7% weekly decline as it digests levels below $80,000–82,000. ETF outflows have been observed for three days. Ethereum is around $2,470–2,480 with slight daily stability but a weekly -2%, while XRP at $1.35 drops -6.6% weekly…
Digital finance is shifting gears. For ten years, the value of a digital asset rested on a promise of appreciation. Since 2024, a new paradigm has taken hold: the value of a tokenized asset is read in its cash flows, rent, interest, coupons—generated by the underlying asset and automatically distributed by smart contracts. RWAs are…
The Financial Times reports a marked shift among wealthy investors toward direct ownership of physical gold and secure, individually allocated storage. In 2026, purchases by this group have surged to record levels, signaling a retreat from electronic exposure in favor of tangible assets.
Industry observers highlight capacity constraints across premier vault facilities. London dealer Sharps…
The defining shift in digital assets this decade is not a price level. It is a change in structure: from instruments whose value rests on uncertain future appreciation to instruments whose value is delivered through continuous, automated cash flows, rent, interest, coupons, distributed by code. The RWA market has quietly completed this migration in 2026,…
The macro regime as of September 2, 2026, shows a strong U.S. dollar (DXY at ~99.73-99.80) and rising 10-year U.S. Treasury yields (4.78-4.81%), pressuring risk assets. An oil supply shock (Brent ~$95.3, WTI ($4,290-4,325/oz) is declining due to real yields and dollar strength. A Hidden Markov Model (HMM) identifies the current regime as "Transition"…
Thesis. Tokenization of real-world assets has fundamentally changed by 2026: it is no longer a speculative resale market but a market of automated cash flows. The value of a RWA is now reflected in its distributions (interest, rents) mechanically analogous to private credit and traditional fixed income, with an added layer of programmability.
Key…
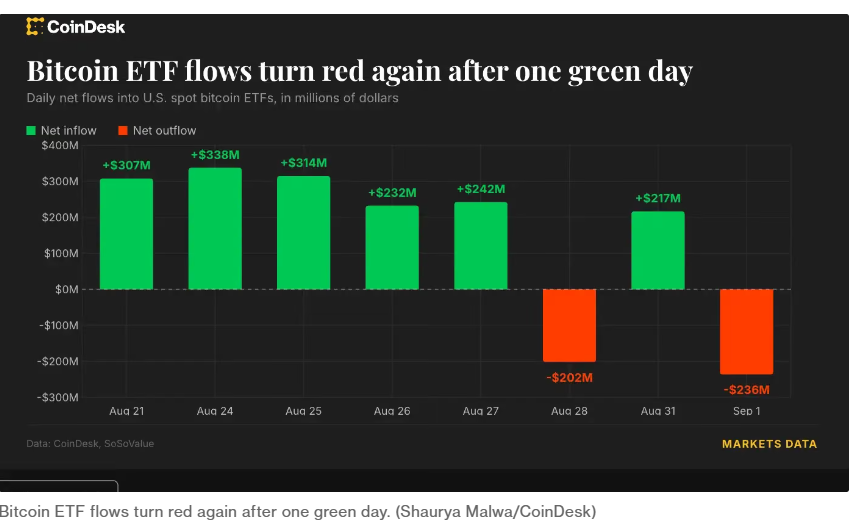
Bitcoin functions as a systemic anchor and market factor. Its circulating supply stands at approximately 19.95–20.08 million BTC. US spot ETFs hold aggregate assets of around 1.3 million BTC, representing about 6–6.5% of the float, with cumulative net inflows of roughly $52 billion despite outflows in 2026.
The ETF channel has replaced the "miner overhang"…
The dominant factor in September is not an endogenous crypto narrative but a regime of real rates and geopolitical energy premiums.
US 10-year yields hit ~4.76-4.78%, the highest since January 2025, while the #DXY traded around 99.45-99.50.
Oil prices (WTI ~$86.5) reacted to US-Iran tensions and the Strait of Hormuz.
The Fed funds target is…
The market has exited the capitulation phase of June 2026, where BTC fell below $60k, driven by ETF creations and short squeezes pushing prices to ~$81.3k, though this does not confirm a sustained bullish cycle. Three simultaneous frictions are identified: a BTC supply wall between $81k-$86k, a potential 25bp hike at the September FOMC meeting…
Bitcoin surged to $76,800-$77,600, gaining 6-8% in 24 hours and 20% for the week. The market saw over $4 billion in 24-hour liquidations, marking the most violent short squeeze of 2026. Combined BTC/ETH ETF inflows exceeded $800 million, indicating massive institutional entries. The funding rate shifted from negative to positive, signaling a return of long…
Analyse de marché
ESG Data Services