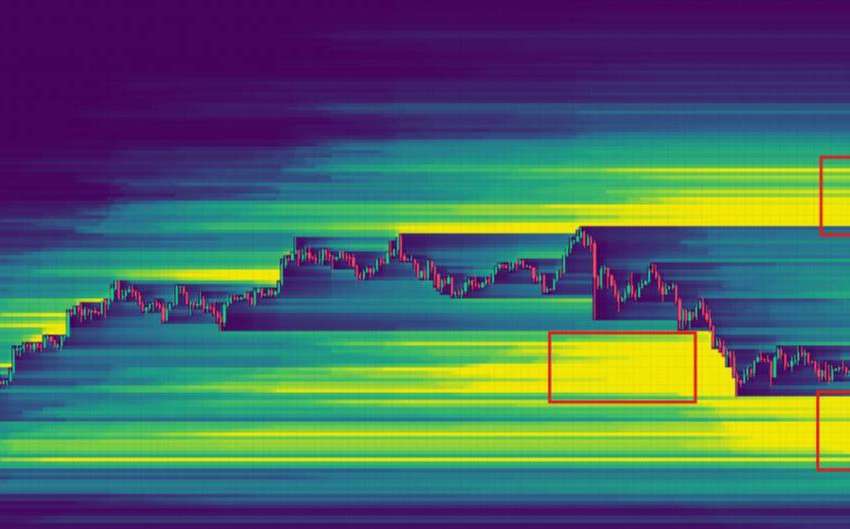
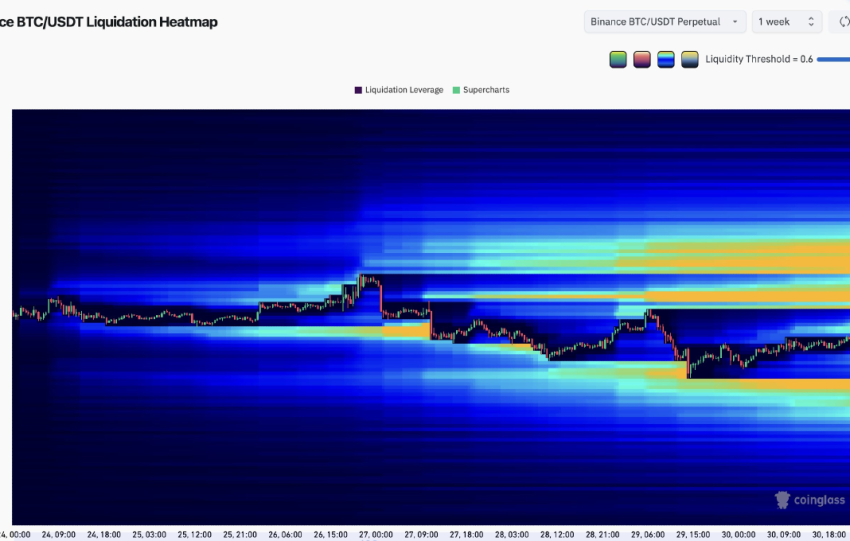
Visual Data: Liquidation density concentrated at $75,000 (long cluster) and $80,000–$85,000 (short clusters). 1-week heatmap showing yellow/orange bands (high density) at 75K and 81K+. Current price in a "blue" area (low density), i.e., compression zone.
Correlation with the April 30th study:
The April 30th study modeled a bimodal distribution of liquidations:
Mode…
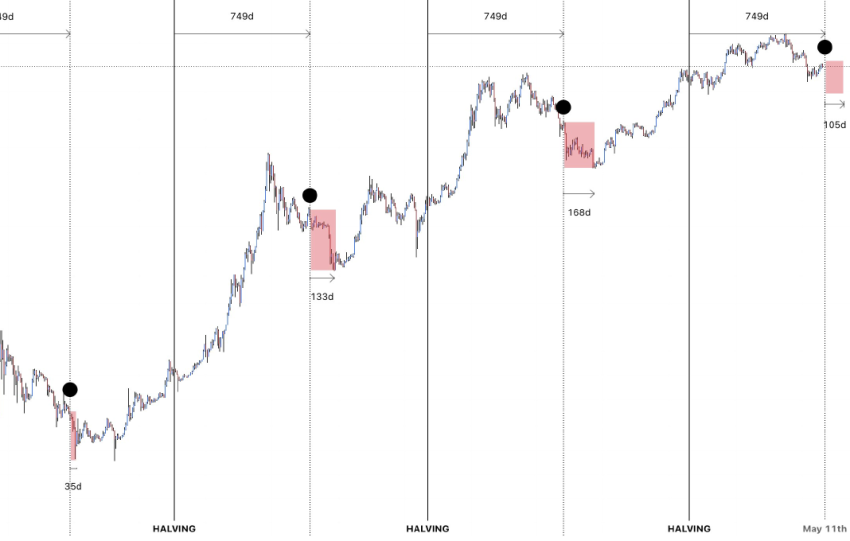
Visual data: ~750 days after each halving mark a cyclical top.
Subsequent capitulation period: 100–170 days. We are at ~750 days since the April 2024 halving.
Correlation with our previous macro studies: The April 28 study postulated a structural decoupling of BTC/NASDAQ with a negative correlation (–0.42). The April 30 study incorporated the…
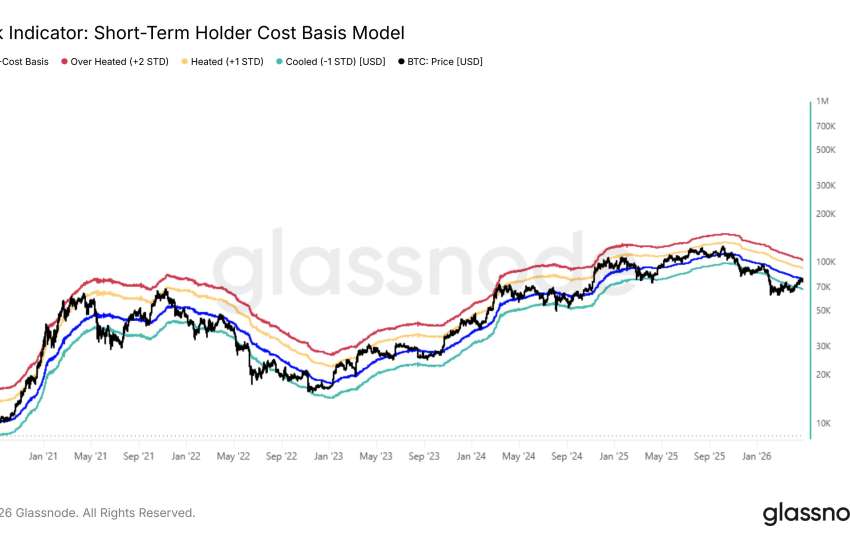
Analysis of Glassnode data as of April 30, 2026, reveals an unprecedented structural compression: Bitcoin is "trapped below market mean," trading at approximately $76,000, below the True Market Mean (around $81,500) and the STH Cost Basis (around $83,000), in a "Cooled" zone (-1σ). The Spot Volume Delta (7-day MA) indicates a stabilization of net selling…
Les 24 checkpoints on-chain (UTC). Automation via Steelldy OSINT 4.2
HeureModuleIndicateurSeuil alerteValeur 02/04Action bot00:00GlassnodeSSR< 2.5 (bull), > 5.0 (bear)3.42🟢 Neutre01:00CryptoQuantNet Minting 24h>$1B+$340M🟡 Surveillance02:00Steelldy PaExchange Reserves BTCHausse soudaine-1,847 BTC/j🔴 Sortie03:00Steelldy SPNarratif "Regulation"Volume >2σBas🟢04:00Steelldy v3.1ETF Net Flow (US open)>$500MEn attente-05:00Steelldy v3.2CTA Liquidation Risk>2M contrats2.4M🔴 Alert06:00Steeelldy v3.1HFT Cluster C1Cassure $64.8kStable🟢07:00Steelldy v2.3DXY Corrélationρ < -0.8-0.74🟡08:00Steelldy v3.1Sentiment Social<-0.5 (fear)+0.12🟢09:00SantimentWhale Accumulation>10k…
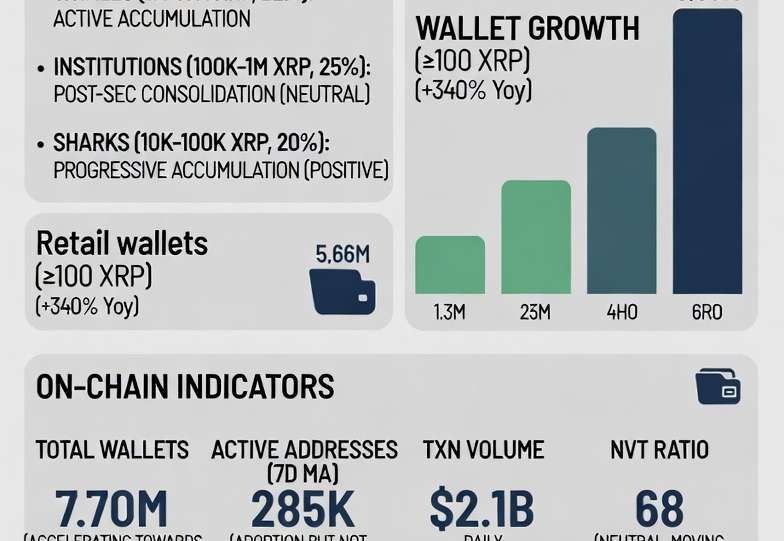
The on-chain and behavioral analysis of XRP highlights a sustained accumulation dynamic supported by various actors. Cohort analysis shows that Mega Whales (>10M XRP, 18% of supply) maintain a silent accumulation (Neutral → Bullish signal), while Whales (1M-10M XRP, 22%) are actively accumulating.
Institutions (100K-1M XRP, 25%) are in post-SEC consolidation (Neutral), and Sharks…
On-chain and behavioral analysis focuses on investor cohorts, modeled by Gaussian Mixture Models, and key indicators.
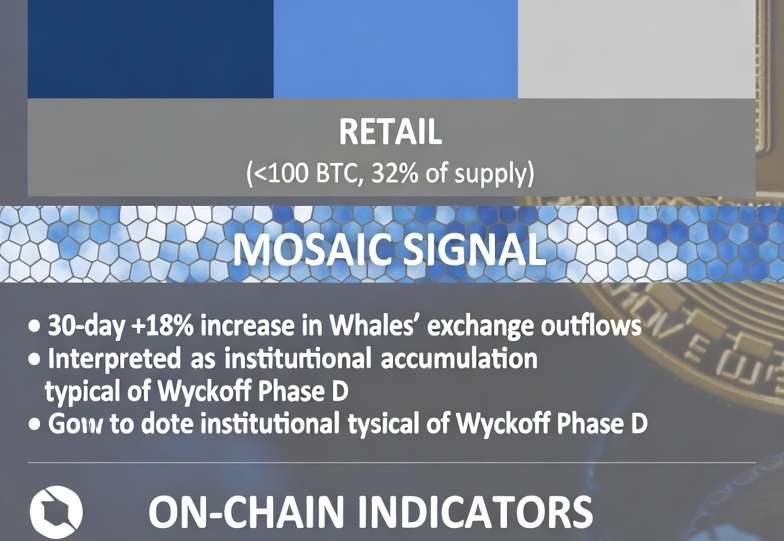
Mega Whales (>10k BTC, 28% of supply) show silent accumulation, signaling a neutral to bullish trend. Whales (1k-10k BTC, 22% of supply) are actively increasing their exchange outflows, indicating active accumulation. Sharks (100-1k BTC, 18% of supply) are in…
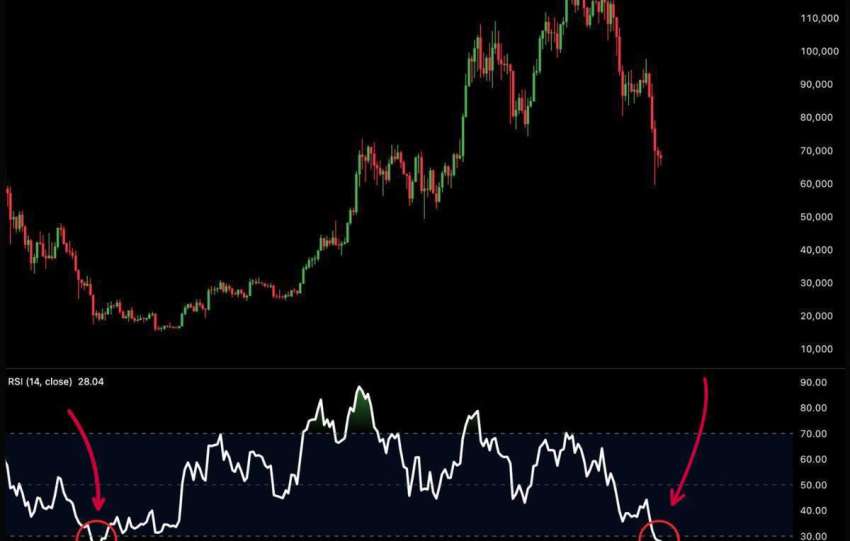
Le Bitcoin montre une configuration technique asymétrique favorable post-rebond de 11.7% (62 400 $ à 69 500 $ en 48h) dans un contexte de capitulation structurelle terminale. Notre analyse indique un ratio risque/rendement de 1:6.2 et une probabilité de scénario haussier de 68% sur 6-10 semaines. La thèse centrale est celle d'une "V-Shaped Accumulation" typique…
I. État des lieux. L'Open Interest (OI) et le levier systémique
Depuis le 1er janvier 2026, l’Open Interest agrégé a chuté de 14 milliards $, signalant un unwinding (dénouement) massif des positions à effet de levier. Cependant, la stabilisation actuelle autour de $66,700 a favorisé une reconstruction rapide de positions Short agressives par des…
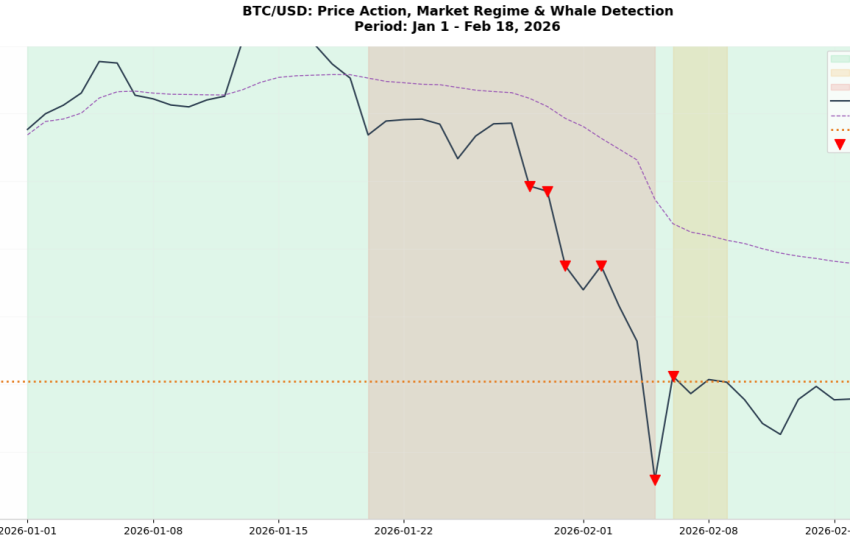
Sur la période étudiée, le Bitcoin a transité d'un régime de Low Volatility Accumulation (~$88,800) vers un scénario de Crisis Deleveraging, touchant un support technique majeur à ~$66,700, soit un drawdown de -24.8%. L’analyse de l’Order Flow révèle une prédominance du Cumulative Volume Delta (CVD) négatif, confirmant que la baisse n'est pas une simple correction…
Notre modèle Steelldy signale un régime de marché extrême où les fondamentaux de risque sont baissiers, mais la dynamique des prix est haussière. Le signal technique est un extrême baissier (-91.5), anticipant un effondrement. Cependant, l'analyse on-chain et les flux institutionnels montrent une forte accumulation. Le marché est dans une "Bull Trap" préliminaire, alimentée par…
Analyse de marché