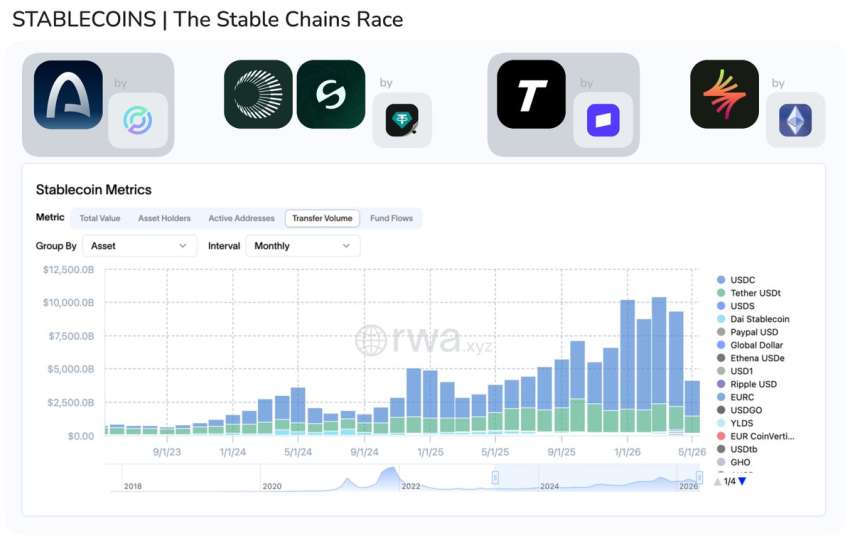
Hedge funds are increasingly adopting new digital currencies, primarily stablecoins, due to enhanced capital efficiency, regulatory clarity, and new yield-generating strategies. 1| Capital Efficiency Unlike traditional prime brokerage where collateral is largely immobilized, stablecoins acting as collateral can simultaneously secure derivative positions (perpetuals, options, futures) and generate yield from underlying assets like T-bills. This "working…
We are not in a classic crypto cycle; we are witnessing the commoditization of the settlement layer. Bretton Woods I (1944) used a gold-pegged dollar settled via correspondent banks (SWIFT/CHIPS). The current regime (post-1971) relies on the petrodollar and sovereign debt. Bretton Woods 2.0 is based on a Dual Pillar Regime:
1. Physical Pillar…
1.1 Direct Ownership Tokens
1.1.1 On-chain Representation of Carbon Credits Held in Custody by the Investor
Direct ownership tokens constitute the most fundamental form of carbon credit tokenization, representing a digital claim on a physical carbon credit held in custody by an accredited custodian. This structure ensures a one-to-one correspondence between the issued token and…
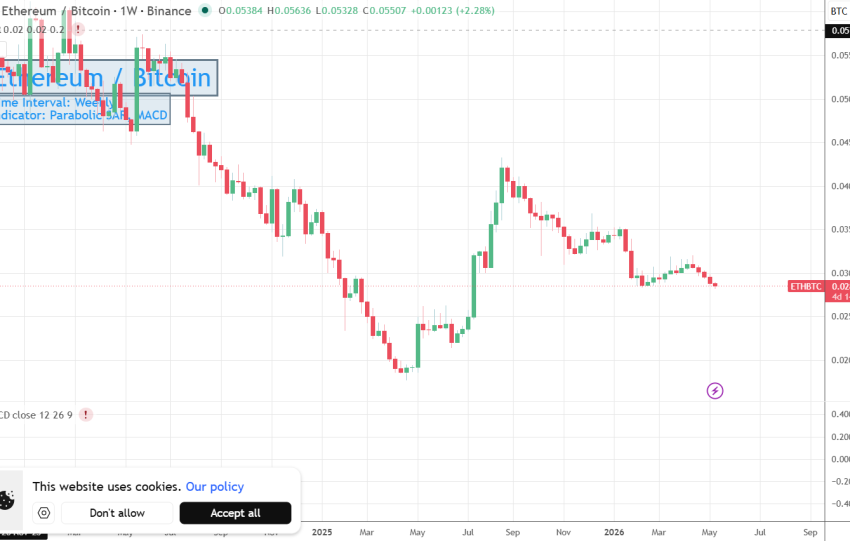
ETH/BTC est le prix relatif de deux systèmes distribués en concurrence. Ses déterminants principaux sont :
Prime de contrat intelligent : capitalisation sur l’écosystème DeFi et les dApps.
Concurrence des "ETH Killers" : Solana, Avalanche, Sui, Aptos, etc., qui érodent la part de marché d’Ethereum.
Mécanisme de destruction EIP‑1559 et frais de gaz : l’activité réseau alimente l’accumulation…
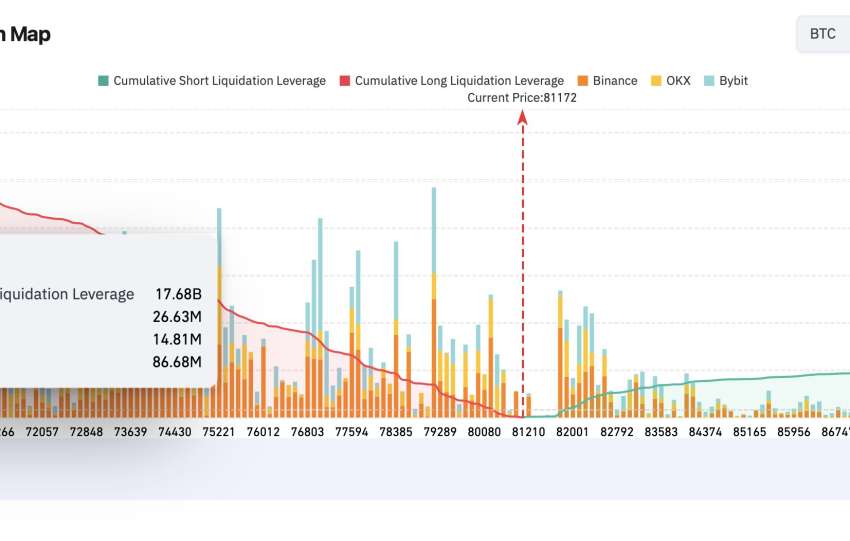
Central Thesis: The integration of Coinglass Liquidation Map data, the 3D rising wedge pattern, and BTC/Stablecoins dominance reveals that BTC has climbed towards 81,800 USD based on 17.68 billion in vulnerable long leveraged positions below current levels. This configuration, superimposed on the geometry of the 3D rising wedge (mechanical target 67,500-70,000 USD in case of…
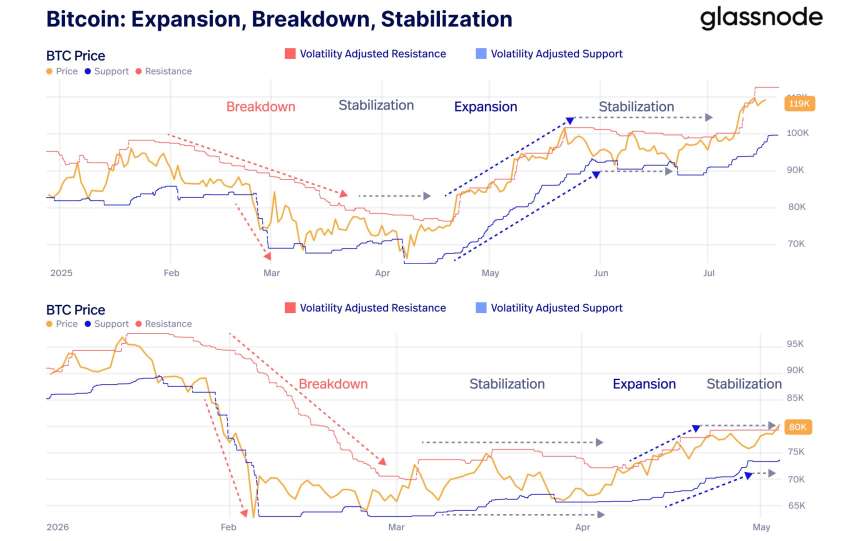
The Glassnode "Expansion, Breakdown, Stabilization" framework identifies a mature stabilization phase with volatility-adjusted support built around ~$74,000 and confluent resistance at $80,000–$83,000. This $78K–$83K zone constitutes the "Breakeven Battlefield" where the following overlap: (i) the STH Cost Basis at $78,700 (v5.0), (ii) the True Market Mean Price at ~$81,500 (v3.0), and (iii) the ETF Cost…
The distinction between a "trap" and a "trigger" in market analysis centers on their nature, observability, agents involved, and timing.
A trap is a static liquidity configuration, often visible in liquidity heatmaps as bid clusters (e.g., 76K–80K), indicating passive retail accumulation and suggesting resistance (high Kyle's Lambda). This configuration can take hours or days…
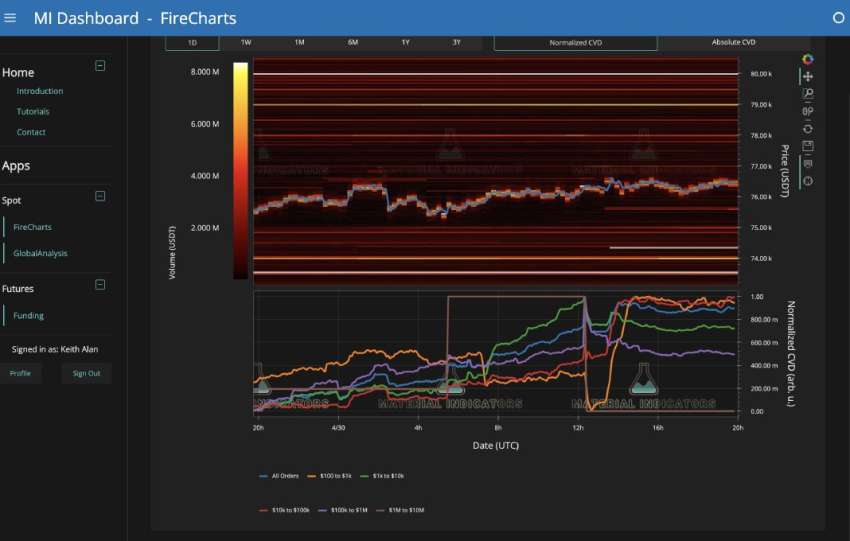
Cohort-Normalized CVD (Cumulative Volume Delta): Colored lines reveal that small orders ($100–$10K, green/orange lines) are buying on upward moves, while large blocks ($1M+, purple lines) are selling. Correlation with our April 27th statements : The April 27th post hypothesized a "stealth institutional distribution" in the $77,000–$80,000 range, with a negative delta of –699.51 and a…
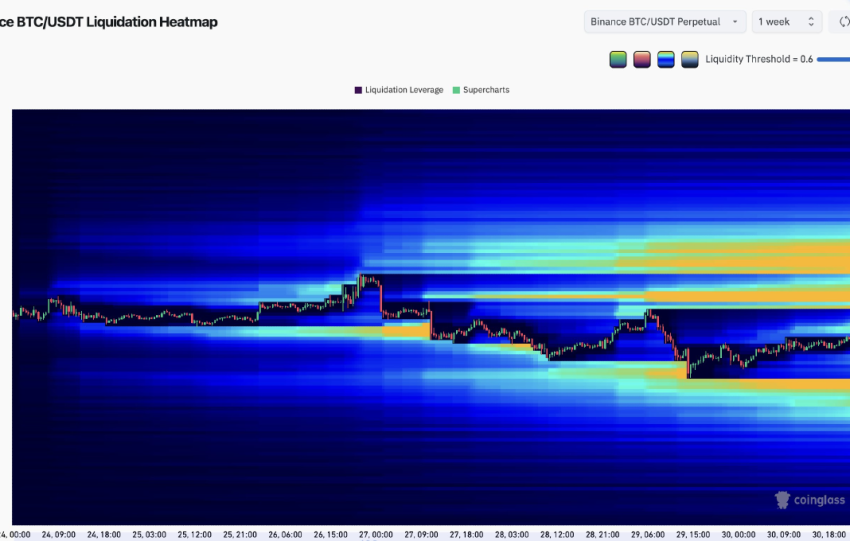
Visual Data: Liquidation density concentrated at $75,000 (long cluster) and $80,000–$85,000 (short clusters). 1-week heatmap showing yellow/orange bands (high density) at 75K and 81K+. Current price in a "blue" area (low density), i.e., compression zone.
Correlation with the April 30th study:
The April 30th study modeled a bimodal distribution of liquidations:
Mode…
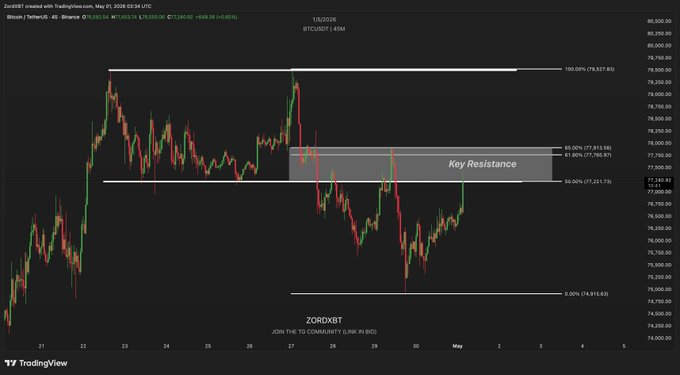
Visual Data:
¤ Clear resistance zone between $77,400 and $78,000 USD.
¤ Fibonacci 65% at $77,411 USD, 61.8% at $77,196 USD.
¤ Current price below resistance.
Correlation with the April 27th Study: The April 27th study identified the selling wall at $79,000–$80,000…
Carbon Credit Market