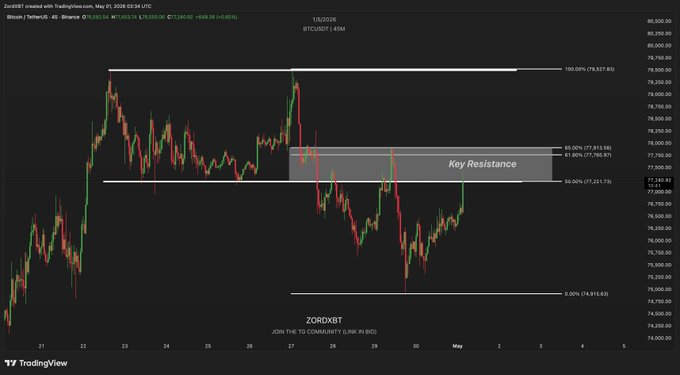
Visual Data:
¤ Clear resistance zone between $77,400 and $78,000 USD.
¤ Fibonacci 65% at $77,411 USD, 61.8% at $77,196 USD.
¤ Current price below resistance.
Correlation with the April 27th Study: The April 27th study identified the selling wall at $79,000–$80,000 USD. The attached chart shows that effective resistance starts lower, at $77,400 USD (grey “Key Resistance” zone). This corresponds to the level where the Hyperliquid whale opened their $30M USD short at $77,500 USD (April 30th study).
Quantitative Implication: The distance between the current price ($76,971 USD) and the immediate resistance ($77,400 USD) is only ~$430 USD (0.56%). This makes 78K–80K calls almost worthless (high theta decay) and strengthens the advantage of tactical shorts with stops above $78,200 USD.