Analyse de marché
According to @BankofAmerica , speculation in the U.S. stock market has reached its highest level since 1999-2000, a period that preceded the start of the longest bull market for gold in modern history. Overvalued stocks and lagging gold are a pattern, not a mystery. On July 6, 2026, gold was around $4,160, down 3% year-to-date, while the S&P 500 rose 9%.
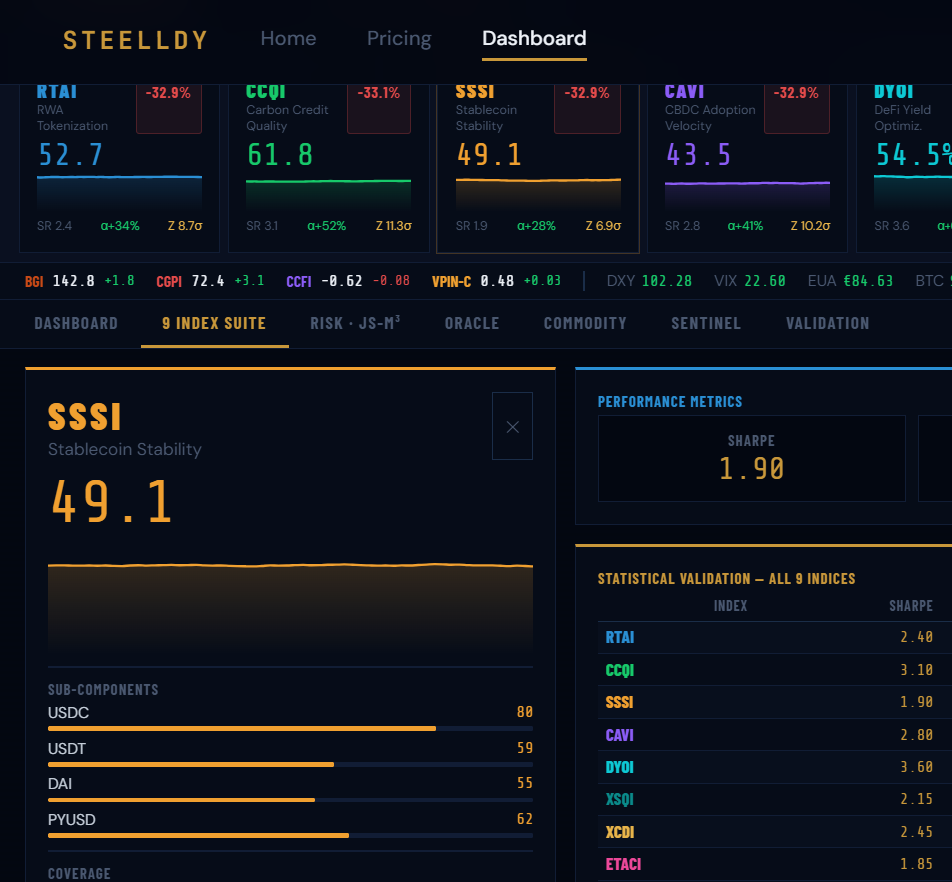
https://www.steelldy-indices.com
On July 5, 2026, Bank of America’s Savita Subramanian reaffirmed her year-end S&P 500 target of $7,100, about 5% below current levels. The bank noted that bear market indicators show speculation has reached extreme levels, with high-multiple stocks gapping sharply, historically preceding a valuation pullback. Throughout the first half of 2026, the bank warned the S&P is overvalued relative to earnings, and no rate hike cycle since 1999-2000 began with such high stock prices. The AI boom has concentrated capital in a narrow list of high-multiple tech stocks, like @MicronTech (up 242% this year) and @SKhynix ‘s upcoming $29 billion @Nasdaq listing. BofA believes further concentration is unlikely and will correct. A linear chart comparing gold and S&P 500 returns since early 2026, indexed to 100 on January 1, shows gold spiked to about 120 in February, then fell sharply, ending down 3%. The S&P 500 steadily rose to a 9% gain. A vertical mark on July 5 highlights BofA’s warning of a potential stock market downturn. The 12-percentage-point gap between these assets is the key argument. The parallel to 1999 is instructive. In August 1999, at the peak of the dot-com boom, gold hit a 20-year low of $252 per ounce. Central banks were sellers, tech stocks yielded 40% annually, and the @FinancialTimes called gold a relic. The Nasdaq peaked in March 2000, tech stocks fell, and gold began to rise from its base, growing for over a decade. From about $254 in 2001 to $1,921 in September 2011, gold rose 659% despite two recessions, a financial crisis, and years of zero interest rates. The mechanism is simple: when yield-bearing assets fall, capital flows into assets that yield nothing. Gold has no price-to-earnings ratio and needs no AI to justify its existence; it simply stores purchasing power outside the financial system. The divergence in 2026 is explained by real yields. When nominal rates rise faster than inflation expectations, non-yielding assets come under pressure. In June, the Fed kept rates at 3.50-3.75%, and nine of eighteen participants foresee a rate hike in 2026. Gold fell about 12% in June, its largest monthly drop since October 2008, but recovered 2.3% in the week ending July 3. The U.S. added only 57,000 jobs in June, well below the expected 110,000, reducing the chance of a September rate hike from 66% to about 50%. Silver rose 6.7% in the same week, and the gold-to-silver ratio fell from above 72 to about 67, indicating industrial buyers are ahead of expected monetary policy easing. Gold fell not due to a structural change, but because the Fed’s hawkish policy boosted real yields, pushing speculative capital into AI stocks. Five major institutions | @StateStreet , @GoldmanSachs , the @GOLDCOUNCIL , @UBS , and @MKSPAMP | all concluded in early July 2026 that the Q2 selloff changed the entry point, not the structural thesis. Structural factors remain: the U.S. budget deficit, growing national debt, and the Fed’s struggle between fighting inflation and avoiding recession. These are temporarily overshadowed by AI hype. BofA’s parallel to 1999 is noteworthy: stock market speculation peaks, gold’s value relative to stocks hits a low. Gold is now extremely cheap relative to stocks, as insurance is always cheapest when no one thinks it’s needed. The FOMC minutes from June 16-17 will be released on July 8. Nine of eighteen members forecast a rate hike in 2026. A hawkish tone could raise September hike odds to 60%, pressuring gold short-term. A dovish tone could open a path to $4,200 and above. In 1999, U.S. stocks were similarly expensive, gold was at a 20-year low of $252, and then gold rose to $1,921. The situation today is different, but the mechanism is the same.