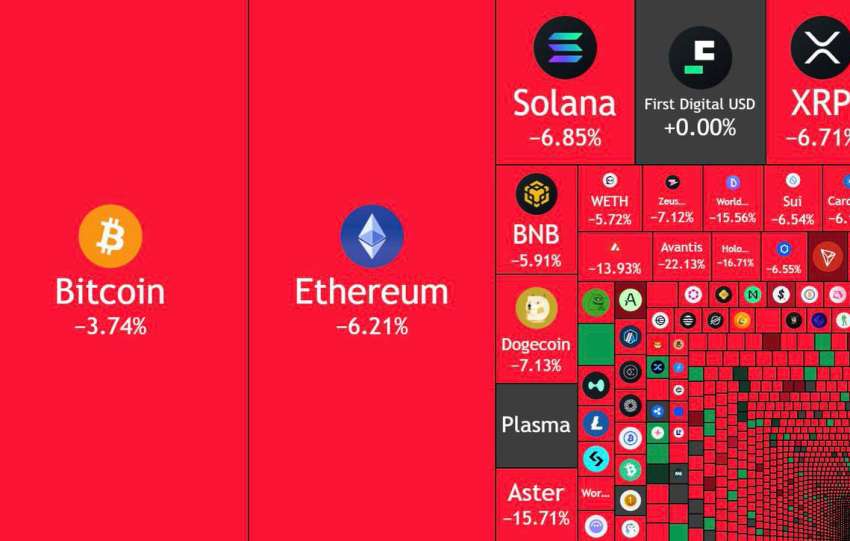
Analyse de marché
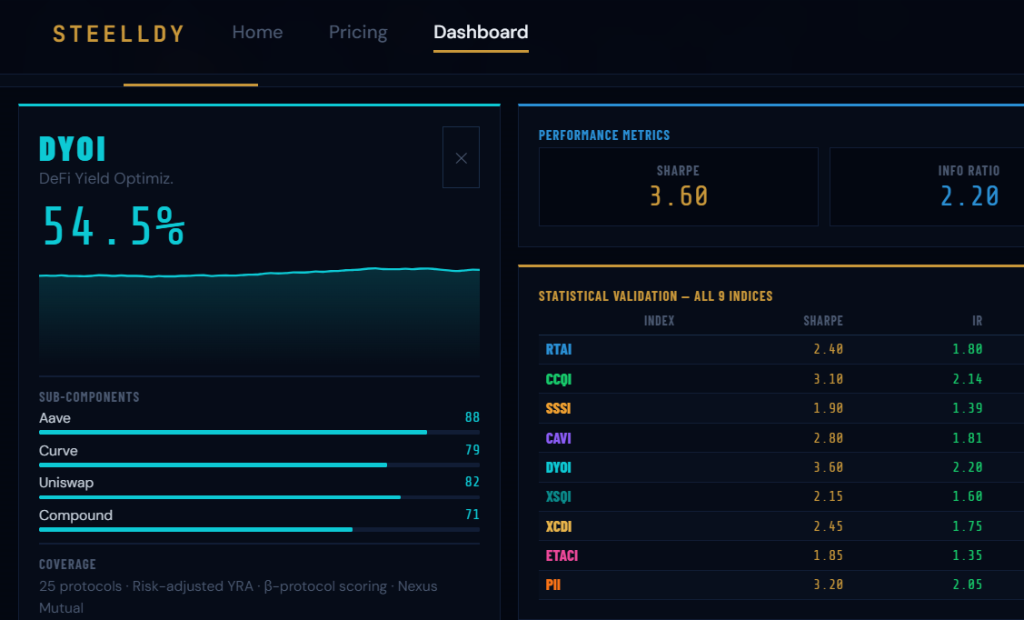
https://www.steelldy-indices.com
The semiconductor memory industry (MU/Samsung/SK Hynix oligopoly controlling >95% of DRAM/HBM) is in a structural supercycle driven by AI data center demand (hyperscalers investing over $300 billion by 2026). Unlike past cycles (2001, 2008, 2013) dominated by PCs and smartphones, current demand is nonlinear, scaling with LLM size and dataset complexity. Sunk costs from data centers (~$180 billion aggregate) create a durable lock-in effect. MU uniquely benefits from 16 multi-year take-or-pay agreements ($22 billion total), providing embedded put options that guarantee a revenue floor independent of market price fluctuations. It achieved a record quarterly revenue of $41 billion and an unprecedented 85% gross margin. HBM4 for NVIDIA Vera Rubin (>6 Tbps bandwidth, TSV/hybrid bonding barriers) strengthens its moat. MU’s recent +12.17% close at $970.82 validates the re-rating, alongside SMCI’s ~+20% surge on massive AI infrastructure orders. These moves confirm DP accumulation signals (M. Theory) and net long commercial positioning per CFTC data.
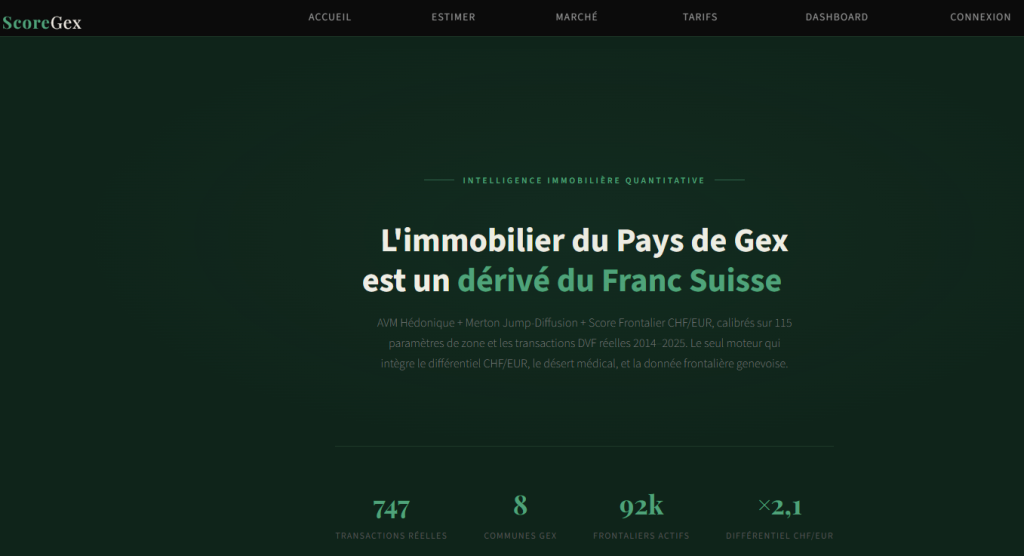
https://scoregex.streamlit.app
The macroeconomic backdrop is characterized by moderate inflation, stable interest rates, and resilient growth, supported by $30 trillion in post-2008 stimulus. The baby boomer consumption peak (2010-2015) has been offset by abundant liquidity, with semiconductors and tech hardware outperforming due to AI. Historical parallels include the 2023-2024 AI rally, 2020-2021 recovery, and the 2016-2017 semi upcycle.
AI demand from hyperscalers (AWS, Azure, Google, Meta, Oracle) is driving over $300 billion in CapEx by 2026. The global memory market is projected at ~$1.09 trillion in 2026 and $1.52 trillion in 2027, with server memory holding a 56-57% share. HBM is particularly constrained, with AI data centers absorbing ~70% of memory production by 2026. MU and SK Hynix lead HBM, with MU’s entire 2026 capacity sold under multi-year contracts. Private credit in tech has grown 47% year-over-year to $1.2 trillion. Demand decomposition shows a structural component of 65-75% due to sunk costs lock-in. There is an 18% probability of a credit contraction tipping point, but a protective floor for MU mitigates risk.
In a 3-player Cournot oligopoly (MU, Samsung, SK Hynix), Nash equilibrium prevents unilateral production increases to avoid price drops. HBM4 investments serve as credible market signals (Spence 1973), strengthening bargaining power with hyperscalers. B. analysis and P. forecasting identify tipping points: unexpected HBM production increase (12%), private credit tech collapse (18%), and structural AI demand slowdown (8%). Scenario distribution: Bullish 62%, Neutral 25%, Bearish 13%. Graph theory (Steelldy 4.2) shows high network centrality among these players, ensuring resilience through multiple connections.