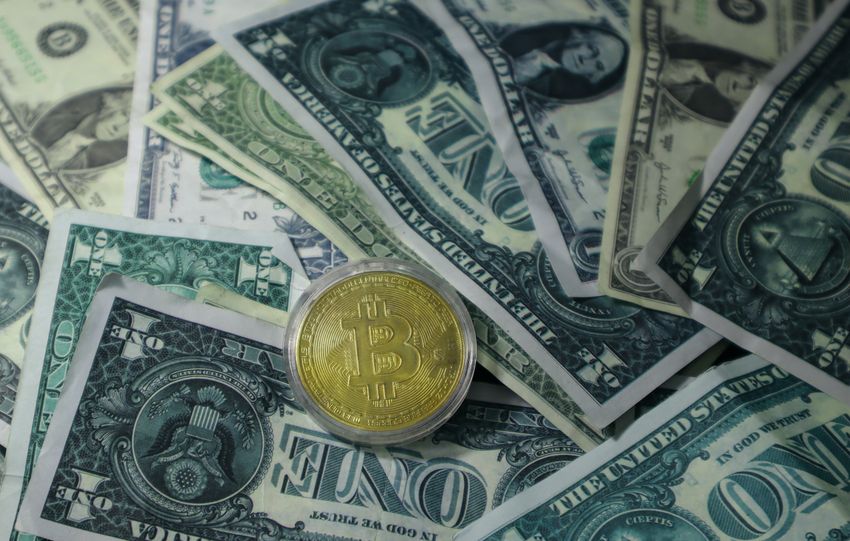
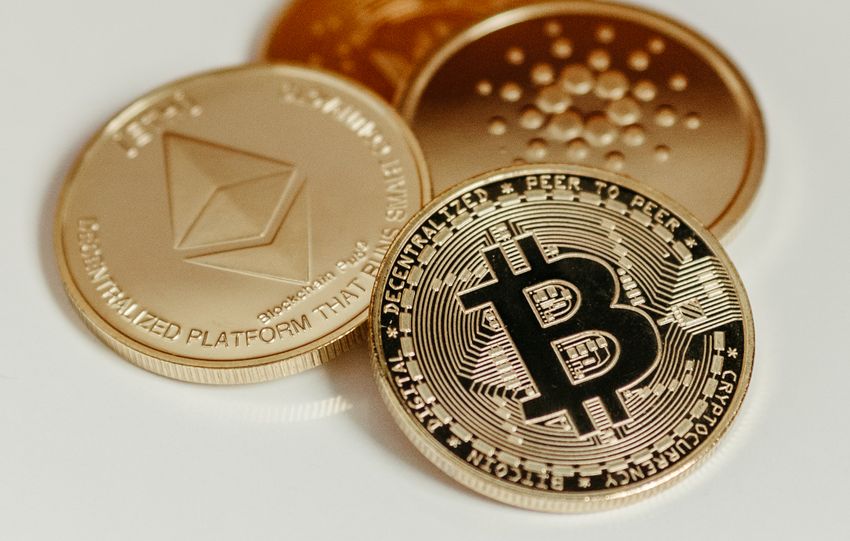
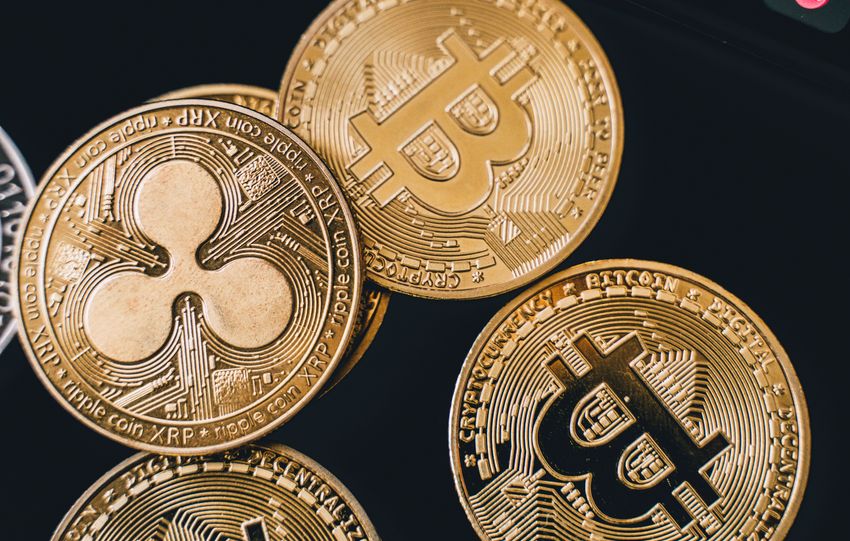
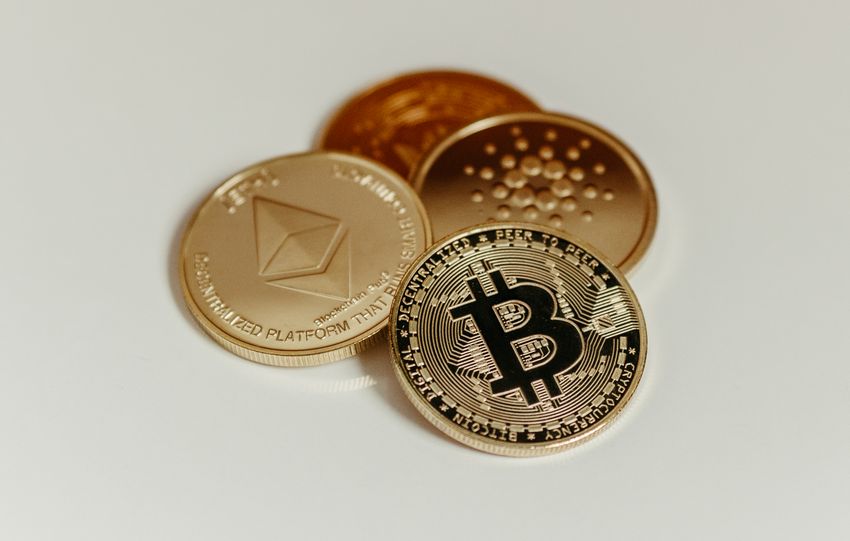
Bitcoin surged to $76,800-$77,600, gaining 6-8% in 24 hours and 20% for the week. The market saw over $4 billion in 24-hour liquidations, marking the most violent short squeeze of 2026. Combined BTC/ETH ETF inflows exceeded $800 million, indicating massive institutional entries. The funding rate shifted from negative to positive, signaling a return of long…
The stablecoin market has crossed a symbolic threshold: a market capitalization of over $315 billion. What was, five years ago, a niche tool for crypto traders has become a cash management infrastructure, for funds, fintechs, corporations, and soon, under the effect of the MiCA regulation, for regulated European institutions. Yet the fundamental question remains unchanged:…
The numbers, first. Tokenized real-world assets crossed $30 billion in early 2026, a 300% year-on-year increase : US Treasury debt ($10.7bn), commodities ($5.1bn), private credit ($2.9bn), institutional alternative funds ($2.2bn) leading the mix. Measured against what is coming, $30bn is a rounding error. The 2030 forecasts, by institution:
Source2030+ forecastScope noteMcKinsey~$2tnExcludes crypto, stablecoins, deposits,…
RWA Treasuries (Sharpe 1.0-1.3 | Volatility 2-3%). Asset representing the tokenization of U.S. Treasury bills (e.g., BUIDL, OUSG).
The high Sharpe ratio (1.0-1.3) with negligible volatility (2-3%) makes it the ideal foundation for "Cash-and-Carry" strategies and collateral for HFT strategies. On-Chain Infrastructure and Regulation: The integration of the BIS (tokenization on a unified ledger)…
https://www.steelldy-indices.com
SpaceX has a gross margin of 55.3%, but negative operating and net margins (-1.8% and -6.9%). Only Starlink connectivity is profitable (~+$1.66B OI), while Space and AI segments are loss-making. AWS boasts a 39.4% operating margin (+650 bps YoY), generating ~60% of Amazon's consolidated OI from ~21% of revenue. Microsoft Cloud's gross margin is…
Revenue decomposition and growth dynamics for Q2 FY26
Consolidated revenue reached 7,814, representing a 91.94% year-over-year increase from 4,071. The total revenue growth of 3,743 is driven by AI compute capacity rental (approx. +1,880, 50.2% of the increase), Starlink Connectivity (approx. +1,700, 45.4%), and Space Launch & other (residual +163). Key margins for Q2 FY26:…
Executive Summary
Copper ("Dr. Copper") remains a useful leading indicator of global industrial activity due to its ubiquitous use (power grids, construction, automotive, electronics, data centers). Futures are currently trading above $6.50/lb (COMEX), up about 30% year-over-year, and are holding above the 50- and 200-day moving averages. The metal formed a trough before equity markets…
The ETH/BTC ratio currently stands at approximately 0.0292–0.0293 (early August 2026), meaning one Ethereum is worth about 2.92–2.93% of one Bitcoin. Recent historical context (2025-2026): - Local peak: 0.0421 (August 24, 2025) - Cycle low: 0.02578 (June 6, 2026), down 38.8% from peak - Current level: ≈0.0292 (August 4, 2026), up 13–14% from the low…
The correlation between Bitcoin and physical gold (XAU/USD) remains weak and unstable over the long term, making them an excellent diversification pair. Long-term (since 2015/3-5 years): average correlation ≈ +0.10 to +0.13. Over one year: typically between -0.17 and +0.32. Short-term (30 days): currently negative (recent readings between -0.31 and -0.46, with extremes at -0.88…
1. Liquidity Pools include: Binance spot ($5-10B daily), Coinbase spot ($1-3B), perpetuals from Binance, Bybit, OKX ($20-40B), CME Futures ($2-5B), US spot ETFs like IBIT and FBTC ($1-3B), and OTC/DP estimated at $2-5B.
2. Institutional flows show CTA trend-following algorithms are neutral with no large liquidation signals. ETF flows have slight net outflows recently,…
Analyse de marché