The ETH/BTC ratio currently stands at approximately 0.0292–0.0293 (early August 2026), meaning one Ethereum is worth about 2.92–2.93% of one Bitcoin. Recent historical context (2025-2026): - Local peak: 0.0421 (August 24, 2025) - Cycle low: 0.02578 (June 6, 2026), down 38.8% from peak - Current level: ≈0.0292 (August 4, 2026), up 13–14% from the low…

The correlation between Bitcoin and physical gold (XAU/USD) remains weak and unstable over the long term, making them an excellent diversification pair. Long-term (since 2015/3-5 years): average correlation ≈ +0.10 to +0.13. Over one year: typically between -0.17 and +0.32. Short-term (30 days): currently negative (recent readings between -0.31 and -0.46, with extremes at -0.88…
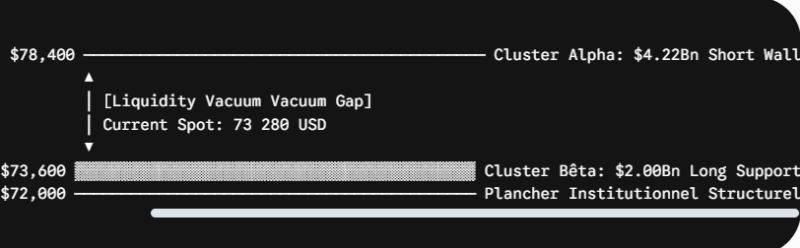
1. Liquidity Pools include: Binance spot ($5-10B daily), Coinbase spot ($1-3B), perpetuals from Binance, Bybit, OKX ($20-40B), CME Futures ($2-5B), US spot ETFs like IBIT and FBTC ($1-3B), and OTC/DP estimated at $2-5B.
2. Institutional flows show CTA trend-following algorithms are neutral with no large liquidation signals. ETF flows have slight net outflows recently,…
Since the end of 2021, the 10-year yield has risen from ~1.5% to a peak of ~5% in autumn 2023, then stabilized around 4.6%. With a CPI at 3.5%, the real rate is: r = i - π = 4.6% - 3.5% = 1.1%
Osaic has already reduced its fixed-income allocation from 40% to…
The US official gold reserves stand at 261,498,926 troy ounces (8,133.5 metric tons), valued at $42.2222 per ounce under the 1973 statute, totaling $11.041 billion. Market value at mid-July 2026 spot prices (~$4,050–4,130/oz) is approximately $1.06–1.08 trillion. Treasury Secretary Scott Bessent confirmed in July 2026 that all gold is accounted for, valuing over $1 trillion…
Summary: Since 2021, the US bond market has experienced upward pressure on yields, with the stock-bond correlation turning positive. Several institutions (Morgan Stanley, Osaic, Sagard) have officially reduced their allocation to fixed income in favor of gold and real assets. This study models this regime change using a two-state HMM, GARCH volatility, and a Merton…
https://www.steelldy-indices.com
Aakash Doshi (State Street) predicts that gold's next $1,000 move will be upward, with consolidation around $4,000 before expanding to $4,750–$5,500. This forecast aligns perfectly with our proprietary quantitative models. By integrating market data, institutional flows, and geopolitical signals through M. Theory 4.2 and leveraging Steelldy Risk Engine 12.4 and Quantum-Classical Hybrid 1.0 on…
https://www.steelldy-indices.com/https://www.steelldy-indices.com
The persistence of armed conflicts (Ukraine, Iran, tensions in Asia) and disruptions in energy supply, analyzed in our previous articles (ST-0726-IRAN-GOLD, ST-0727-CHINA-GOLD), validate a fundamental premise of quantitative finance: wars are the primary driver of debt monetization and hidden inflation that erodes savers' wealth. Faced with a deficit in traditional financing (tax collection, bond…
Synthetic carbon credit tokens provide derivative exposure to carbon markets (e.g., ICE EUA, voluntary indices) via futures, total return swaps, or oracle-replicated performance, without physical custody or retirement of underlying credits. This delivers operational efficiency (fractionalization, 24/7 liquidity, reduced verification costs) but introduces material counterparty risk (issuer solvency/fulfillment), basis/tracking error risk (deviation from reference index…
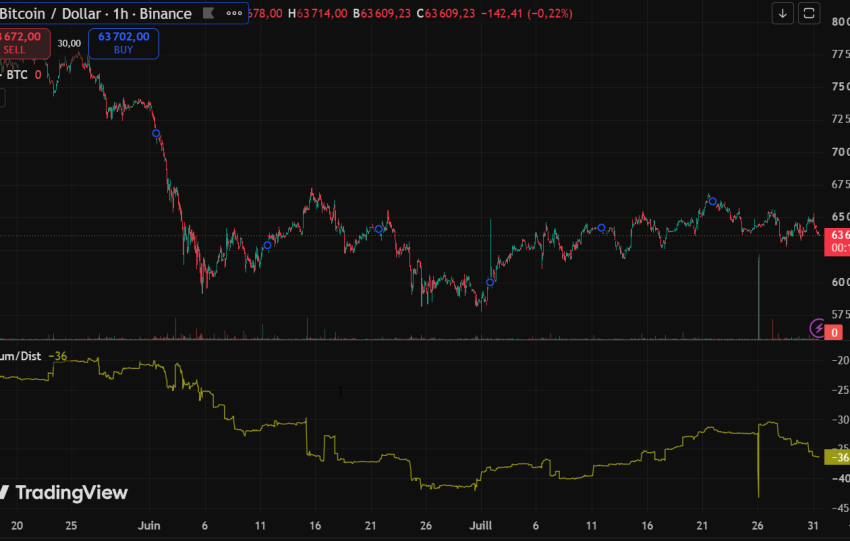
Bitcoin’s Sell-Side Risk Ratio Hits Critical “Very Low Liquidity” Zone: A Precursor to Major Upside?
The Bitcoin Sell-side Risk Ratio (SRR) has reached a critical "Very Low Liquidity" level in May 2026, mirroring major market bottoms in 2018, 2020, and 2023. The SRR, calculated as realized absolute profit and loss divided by realized capitalization, indicates extreme sell-side exhaustion when below 0.001.
Historically, such compressions have preceded significant price expansions:…
Analyse de marché