Analyse de marché
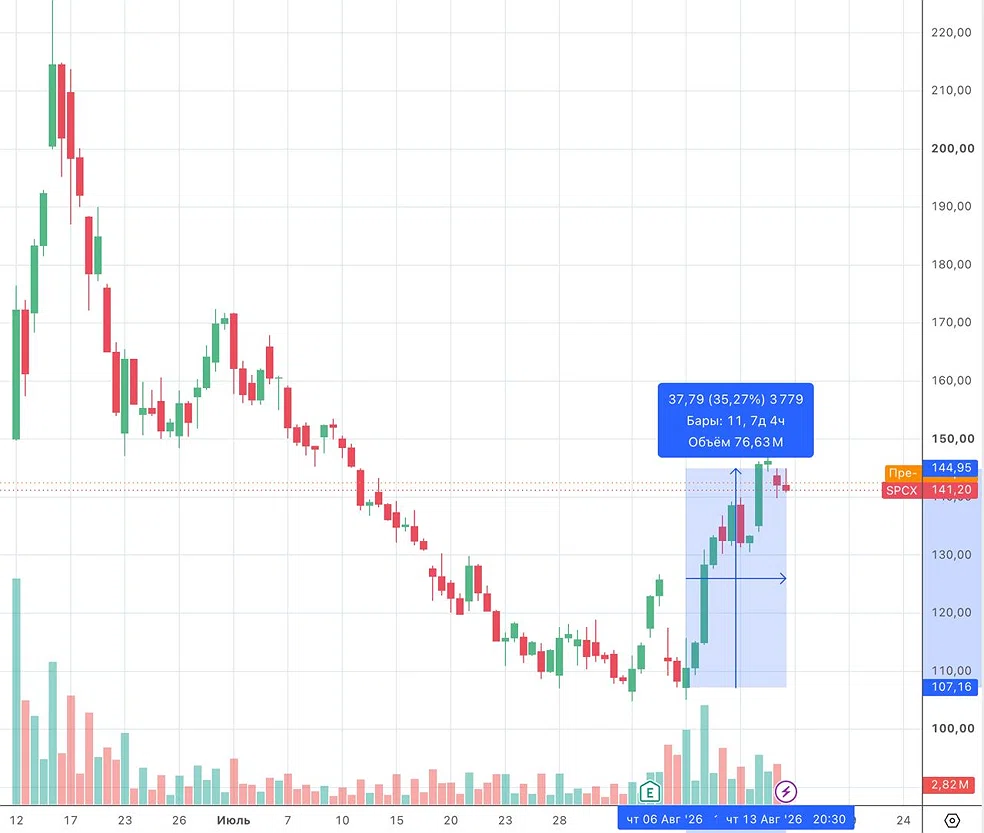
The chart analysis (daily SPCX candlesticks, mid-June to mid-August 2026) confirms negative convexity from massive retail participation. The IPO on June 12, 2026, was at $135, peaking at $225.64 (+67%) on June 16, then bottoming around $105-110 in late July/early August. A recent rebound (highlighted blue zone) shows +37.79 points (+35.27%) over 11 days 7 hours, volume 76.63M, with the current price at $141-146. Market cap fluctuated between ~$3,000B (peak) and ~$2,040B (low), with short interest rising from 8% to 13% of free float in one session. This setup shows classic symptoms of a euphoric retail-heavy cycle peak (allocation 20-30% vs. usual 5-10%).
Calibrated probabilities (Monte Carlo + Markov-switching) indicate a >30% correction in 6-12 months at 62-78% (Late-Cycle Euphoria regime), with average amplification via liquidity spirals at 2.3x–2.5x, and a 1-month VaR 99% (retail-heavy exposure) at 22-35%.
Fundamentally, in Q2 2026, Starlink (Connectivity) generated $4,291M revenue (+66%) and $1,656M operating profit (only profitable segment), AI (xAI/Grok/X) had ~$2,600M revenue (+247%) but -$1,260M loss, Space (Launchers/Starship) brought $962M revenue (+29%) with -$542M loss, totaling $7,814M revenue (+92% YoY) and a net loss of -$541M. CAPEX was $18.4B (vs. $2.8B in Q2 2025). AI and space remain loss-making; only Starlink generates positive cash flow.
The IPO valuation (~94x revenue) and consensus projections (FY2026E revenue $44.75B, PT $222-240) remain aggressive. The risk framework highlights negative convexity (first derivative positive in FOMO phase, second negative post-peak, accelerating sales and liquidations).
The Brunnermeier-Pedersen model (liquidity spirals) and Hawkes process for margin call clustering show high self-excitation due to hedge fund leverage (4-6x) and retail (25-30%). Prospect theory (Kahneman-Tversky, loss aversion λ>1) amplifies cascading sales. The detected regime (Markov-switching VAR) is Liquidity Trap/Late-Cycle Euphoria (probability 68-72%). Stochastic projections (Monte Carlo 100k) with calibrated parameters (retail 25-30%, leverage 4.5-5.5x, daily volatility 2.8-3.2%, fire-sale impact 0.0012-0.0015) show: a 65% probability of >15% correction in 6-12 months, 42-49% for >30% correction, 58-68% for a complete spiral (≥3 margin calls), average drawdown of -28 to -31%, and worst 5% at -52 to -58%.
The long-term thesis hinges on @SpaceX ‘s transition from a launch provider + constellation company to a multi-planetary space infrastructure + data + AI operation with increasing returns and extreme barriers to entry. The price may therefore drop in the short term and multiply in the long term (x5). This is not contradictory: it is the classic signature of assets with negative short-term convexity and positive long-term convexity (real option on disruptive technologies).
The reason is structural: SpaceX holds real options on markets (global connectivity, low-cost launch, orbital compute, multi-planetary logistics) whose discounted value can grow non-linearly once evidence of execution is provided. The short-term price is dominated by microstructure and retail sentiment. The long-term price will be dominated by free cash-flow generation and the scarcity of space infrastructure.