Analyse de marché
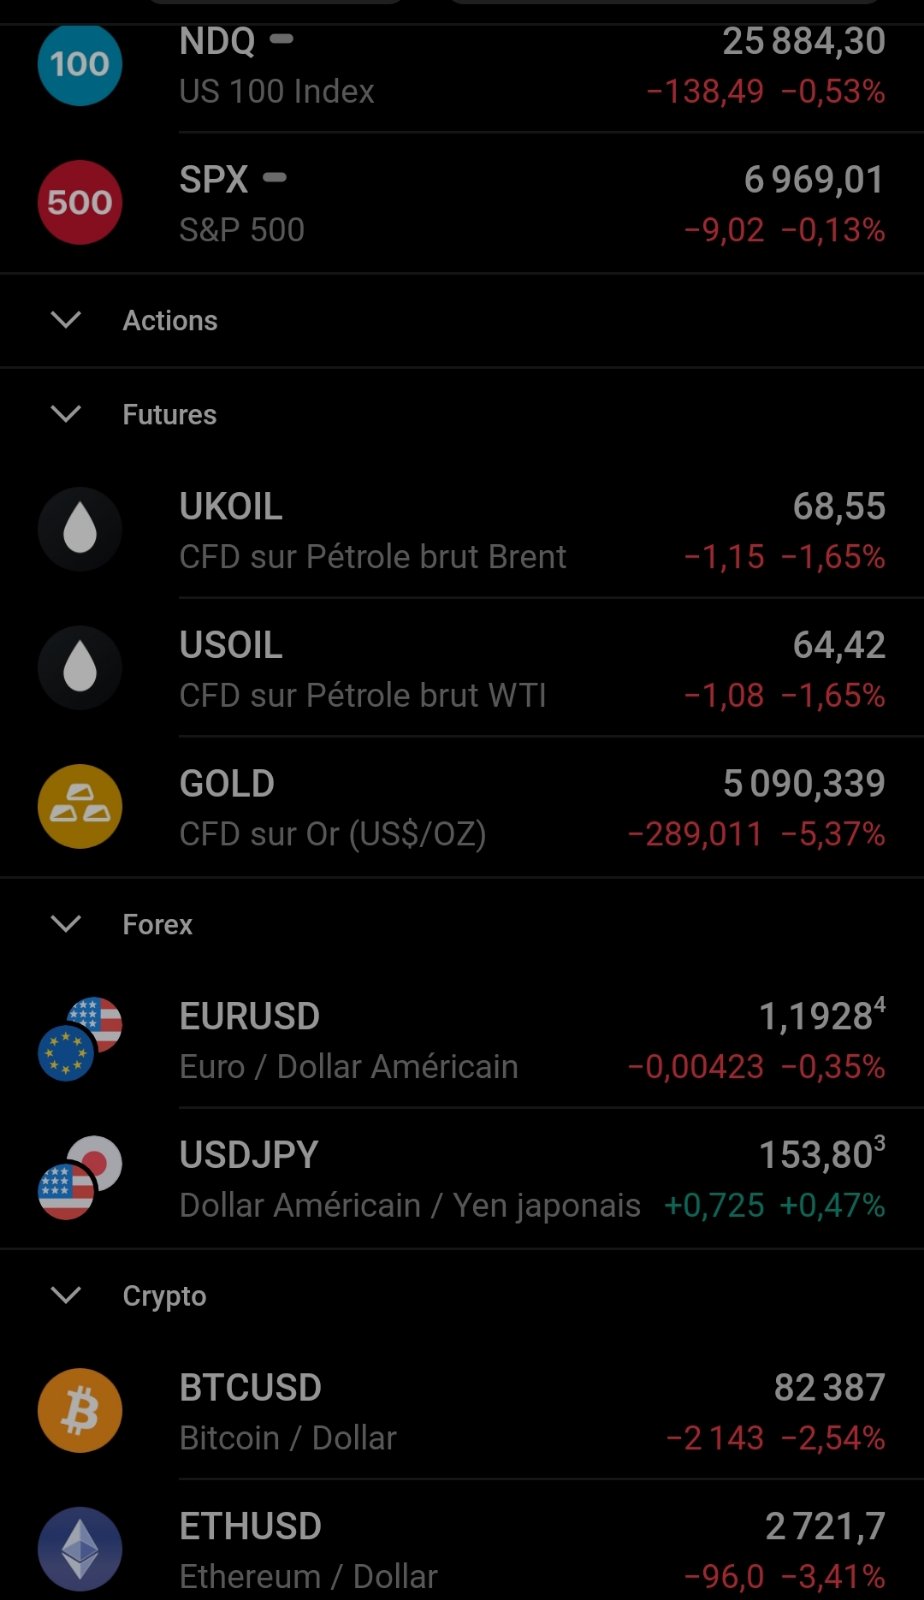
Share This Article
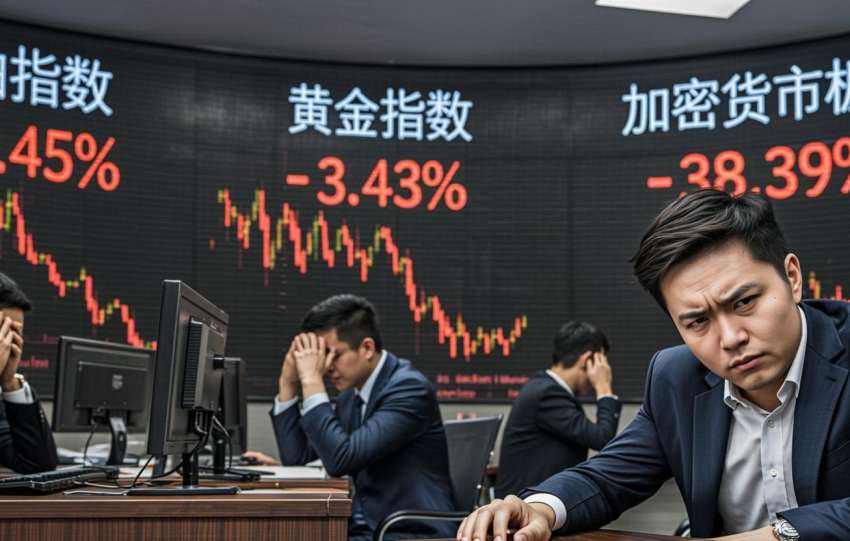
For the first time since March 2020, an unprecedented synchronized sell-off is affecting all asset classes (equities, energies, precious metals, currencies, cryptos), indicating systemic liquidity stress and an abnormal correlation of 1.0. Our system (Steelldy) has detected structural changes in correlations, notably the Gold/SPX correlation moving from -0.35 to +0.82 (panic signal) and the Oil/Tech correlation moving from -0.15 to +0.75 (recession signal). The inversion of the USDJPY/VIX correlation to -0.65 signals the unwinding of the carry trade. This situation is not a simple correction but the simultaneous activation of four negative feedback loops: the unwinding of the Yen carry trade, debt-driven deflation leading to a compression of risky assets, global liquidity contraction due to central bank balance sheet tightening, and the realization of recession risk where gold loses its safe-haven role.
1. Anatomy of the correlation at 1.0
Our study compares theoretical models of asset correlations (Risk-Off, Inflation, Deflation) with a current state based on a 5×5 matrix of SPX, Brent, Gold, USDJPY, BTC. The theoretical regimes describe opposite movements depending on the economic context. The current matrix shows mostly positive correlations, except with USDJPY (negative). The interpretation suggests that all assets are declining except for the appreciating JPY, indicating forced global deleveraging.
Current status detected (5×5 Correlation Matrix):
| Asset | SPX | Brent | Gold | USDJPY | BTC |
|---|---|---|---|---|---|
| SPX | 1.00 | +0.75 | +0.82 | -0.60 | +0.68 |
| Brent | +0.75 | 1.00 | +0.71 | -0.55 | +0.65 |
| Gold | +0.82 | +0.71 | 1.00 | -0.70 | +0.73 |
| USDJPY | -0.60 | -0.55 | -0.70 | 1.00 | -0.62 |
| BTC | +0.68 | +0.65 | +0.73 | -0.62 | 1.00 |
Interpretation: All assets are moving down together except for the JPY which is appreciating. This is the signature of a forced global deleveraging.
The Gold Shock -5.37%: The Decisive Indicator
The -5.37% drop in gold represents an exceptional move, ranking in the 99th percentile of daily variations over the last 20 years. This fall caused a break below a key technical support level, the 200-day moving average, at the $5,100 level. Furthermore, the Gold/SPX ratio fell below 0.73, its lowest level since November 2023. Several factors explain this correction. The most likely scenario (60%) is forced selling due to margin calls on other assets, probably equities. This is supported by gold volume three times higher than normal, concentrated during Asian hours, suggesting that funds are liquidating gold to cover their funding calls. A lower probability (25%) is linked to the evolution of the inflation narrative. The recent announcement of a Core PCE reading of 1.8% (below the Fed’s target) is leading the market to anticipate disinflation or deflation, thereby diminishing gold’s appeal as an inflationary hedge. Finally, a coordinated central bank intervention (15%) to defend currencies or finance other operations is a possibility, although less supported by direct indicators. The diagnosis therefore points strongly towards a liquidity issue and forced portfolio rebalancing, with a secondary influence due to the changing inflation outlook.
2. The four negative feedback loops
2.1 Loop °1: Unwinding the Yen Carry Trade
The Yen carry trade (USDJPY at 153.80) is profitable but exposed to major foreign exchange risk. Fear of an intervention by the BoJ/MOF at the 155.00 USDJPY threshold forces an early exit from JPY short positions, leading to its appreciation. This triggers a forced deleveraging of positions funded in JPY, resulting in the sale ($3.1T at high velocity) of global assets (stocks, gold, crypto) to buy back Yen. This dynamic explains the negative correlation observed between USDJPY and these assets.
Mechanism:
USDJPY at 153.80 → High carry trade profitability but extreme exchange rate risk
↓ Fear of BoJ/MOF intervention to curb JPY weakness
↓ Early exit from JPY short positions
↓ JPY appreciation → Decreased carry trade profitability
↓ Forced deleveraging of JPY-funded positions
Sale of global assets (Stocks, Gold, Crypto) to buy JPY.
Quantitative data:
Estimated carry trade exposure: $11.5T (BIS)
High-velocity portion: $3.1T (potential to exit in <48h)
Critical USDJPY threshold: 155.00 (presumed intervention level)
Impact on correlations: Explains the negative correlation between USDJPY and other assets.
2.2 Loop °2: Debt-Deflation
The indicators suggest a trend toward debt deflation: Credit Spreads (CDX IG) widened by 8 basis points to 59.2 bp (the highest level since October 2023), 10-year real rates (TIPS) increased by 15 basis points to reach 2.45% (a sign of financial tightening), and M2 money supply is contracting annually by -0.8%. Fisher’s mechanism (1933) describes how over-indebtedness leads to asset sales, causing a drop in their price and a reduction in the net worth of economic agents. This results in lower consumer spending and investment, generating price deflation. Consequently, the real burden of debt increases, forcing further asset sales, creating a deflationary spiral. The recent drop in gold is analyzed as being in line with this pattern, indicating that gold does not offer protection against debt-induced deflation.
2.3 Loop °3: Global Liquidity Contraction
“Cycle °3” describes a contraction in global liquidity, marked by several indicators. The Fed’s overnight reverse repurchase agreement facility (Fed RRP) stands at $145 billion, down $37 billion over one week. The SOFR-OIS spread is 16 basis points (up from 6 previously), signaling growing tightness. The Treasury General Account (TGA) increased by $50 billion this week, reaching $810 billion. Global central bank balance sheets are down $2.1 trillion year-over-year. This liquidity contraction reduces the “cash available” for asset purchases, leads to an increase in funding costs (margins, repo), and exerts selling pressure on the most liquid assets like gold and large caps, in order to generate liquidity.
2.4 Loop °4: Realization of Recession Risk
The economic cycle indicates a sustained risk of recession supported by an inverted yield curve (-85bps), falling LEI (-3.2% YoY), and a contracting global PMI (48.7). Consumer confidence is dropping. These signals imply a decrease in oil (anticipated weak demand) and gold (deflationary risk), as well as an underperformance of technology stocks due to multiple compression.
3. Scenario Modelig on Steelldy
Scenario modeling on STEELLDY covers a period of 1 to 30 days with 50,000 Monte Carlo iterations. Stochastic variables include USDJPY, VIX, Fed RRP, and Credit Spreads, with potential exogenous shocks (BoJ intervention, emergency Fed meeting, corporate default). Four scenarios are probabilized: A, Controlled Liquidation (40%, -5% to -8% on SPX); B, Liquidity Crisis (35%, -12% to -18% on SPX); C, Structural Deflation (20%, -18% to -25% on SPX); and D, Massive Intervention (5%, +5% to +15% on SPX). Extreme stress outputs show a 99%/10d VaR of -14.3% and a 95% ES of -18.7%. The correlation breakdown point is set at USDJPY = 154.50.
4. Advanced Stress Indicators
The Liquidity Stress Index (LSI) is at 78.5/100 (Orange), close to red. The cross-asset liquidity score is dangerously low (3.2/10), measuring the difficulty in selling $1 billion without impact. The debt-to-margin ratio is at 3.1, a pre-2008 level. Flows show record ETF outflows (-$42.3B over 7 days) and significant outflows from mutual funds and US markets by foreign investors. Technical indicators are extreme: an SPX down day with downside volume exceeding 90% and a Trin Index at 2.45 (signaling panic selling), as well as a Put/Call Ratio of 1.35, indicating extreme fear.
5. Sectorial Implications
5.1 Sectoral Sensitivity Matrix
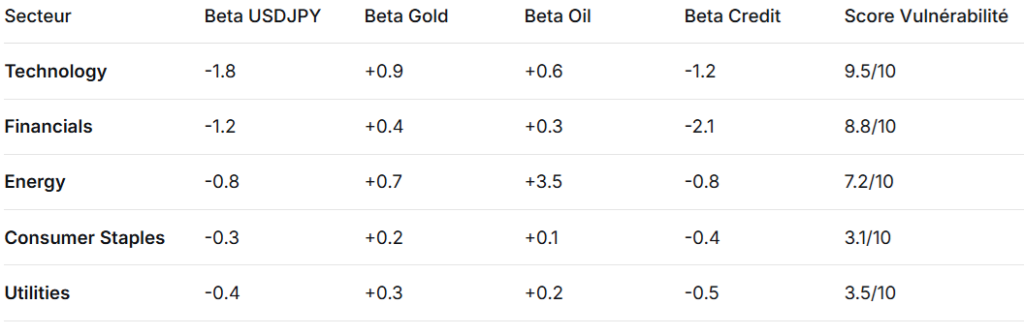
5.2 Immediate Actions by Sector
30% reduction on Tech (NVDA, AAPL, MSFT) with JPY hedging. Financiers require caution on credit (preferring strong deposits). Strategic Gold accumulation if Brent < $65, despite price paradox. Avoid Gold Miners (NEM, GOLD) due to leverage and low P/E outlook.
6. “Minsky Moment” Risk
Global financing is migrating from the speculative regime (income covering interest) to the Ponzi regime (new debt to pay interest), according to Hyman Minsky’s model. The conditions for a “Minsky Moment” are met: high leverage (record margin debt), complex financial innovations (crypto, derivatives), and prolonged complacency (low VIX). An exogenous shock, such as the USDJPY movement, could precipitate the crisis. Reaching the 155.00 level for USDJPY is associated with a 65% probability of this critical moment.
The synchronized market decline reveals a fundamental imbalance: the contraction of global liquidity while valuations anticipated continuous expansion. The falling gold is worrying, signaling the failure of traditional hedges. Oil is declining despite geopolitical tensions, suggesting that demand is being superseded by a recession outlook. Finally, the Yen is strengthening despite the Bank of Japan’s policy, indicating massive deleveraging.