Analyse de marché
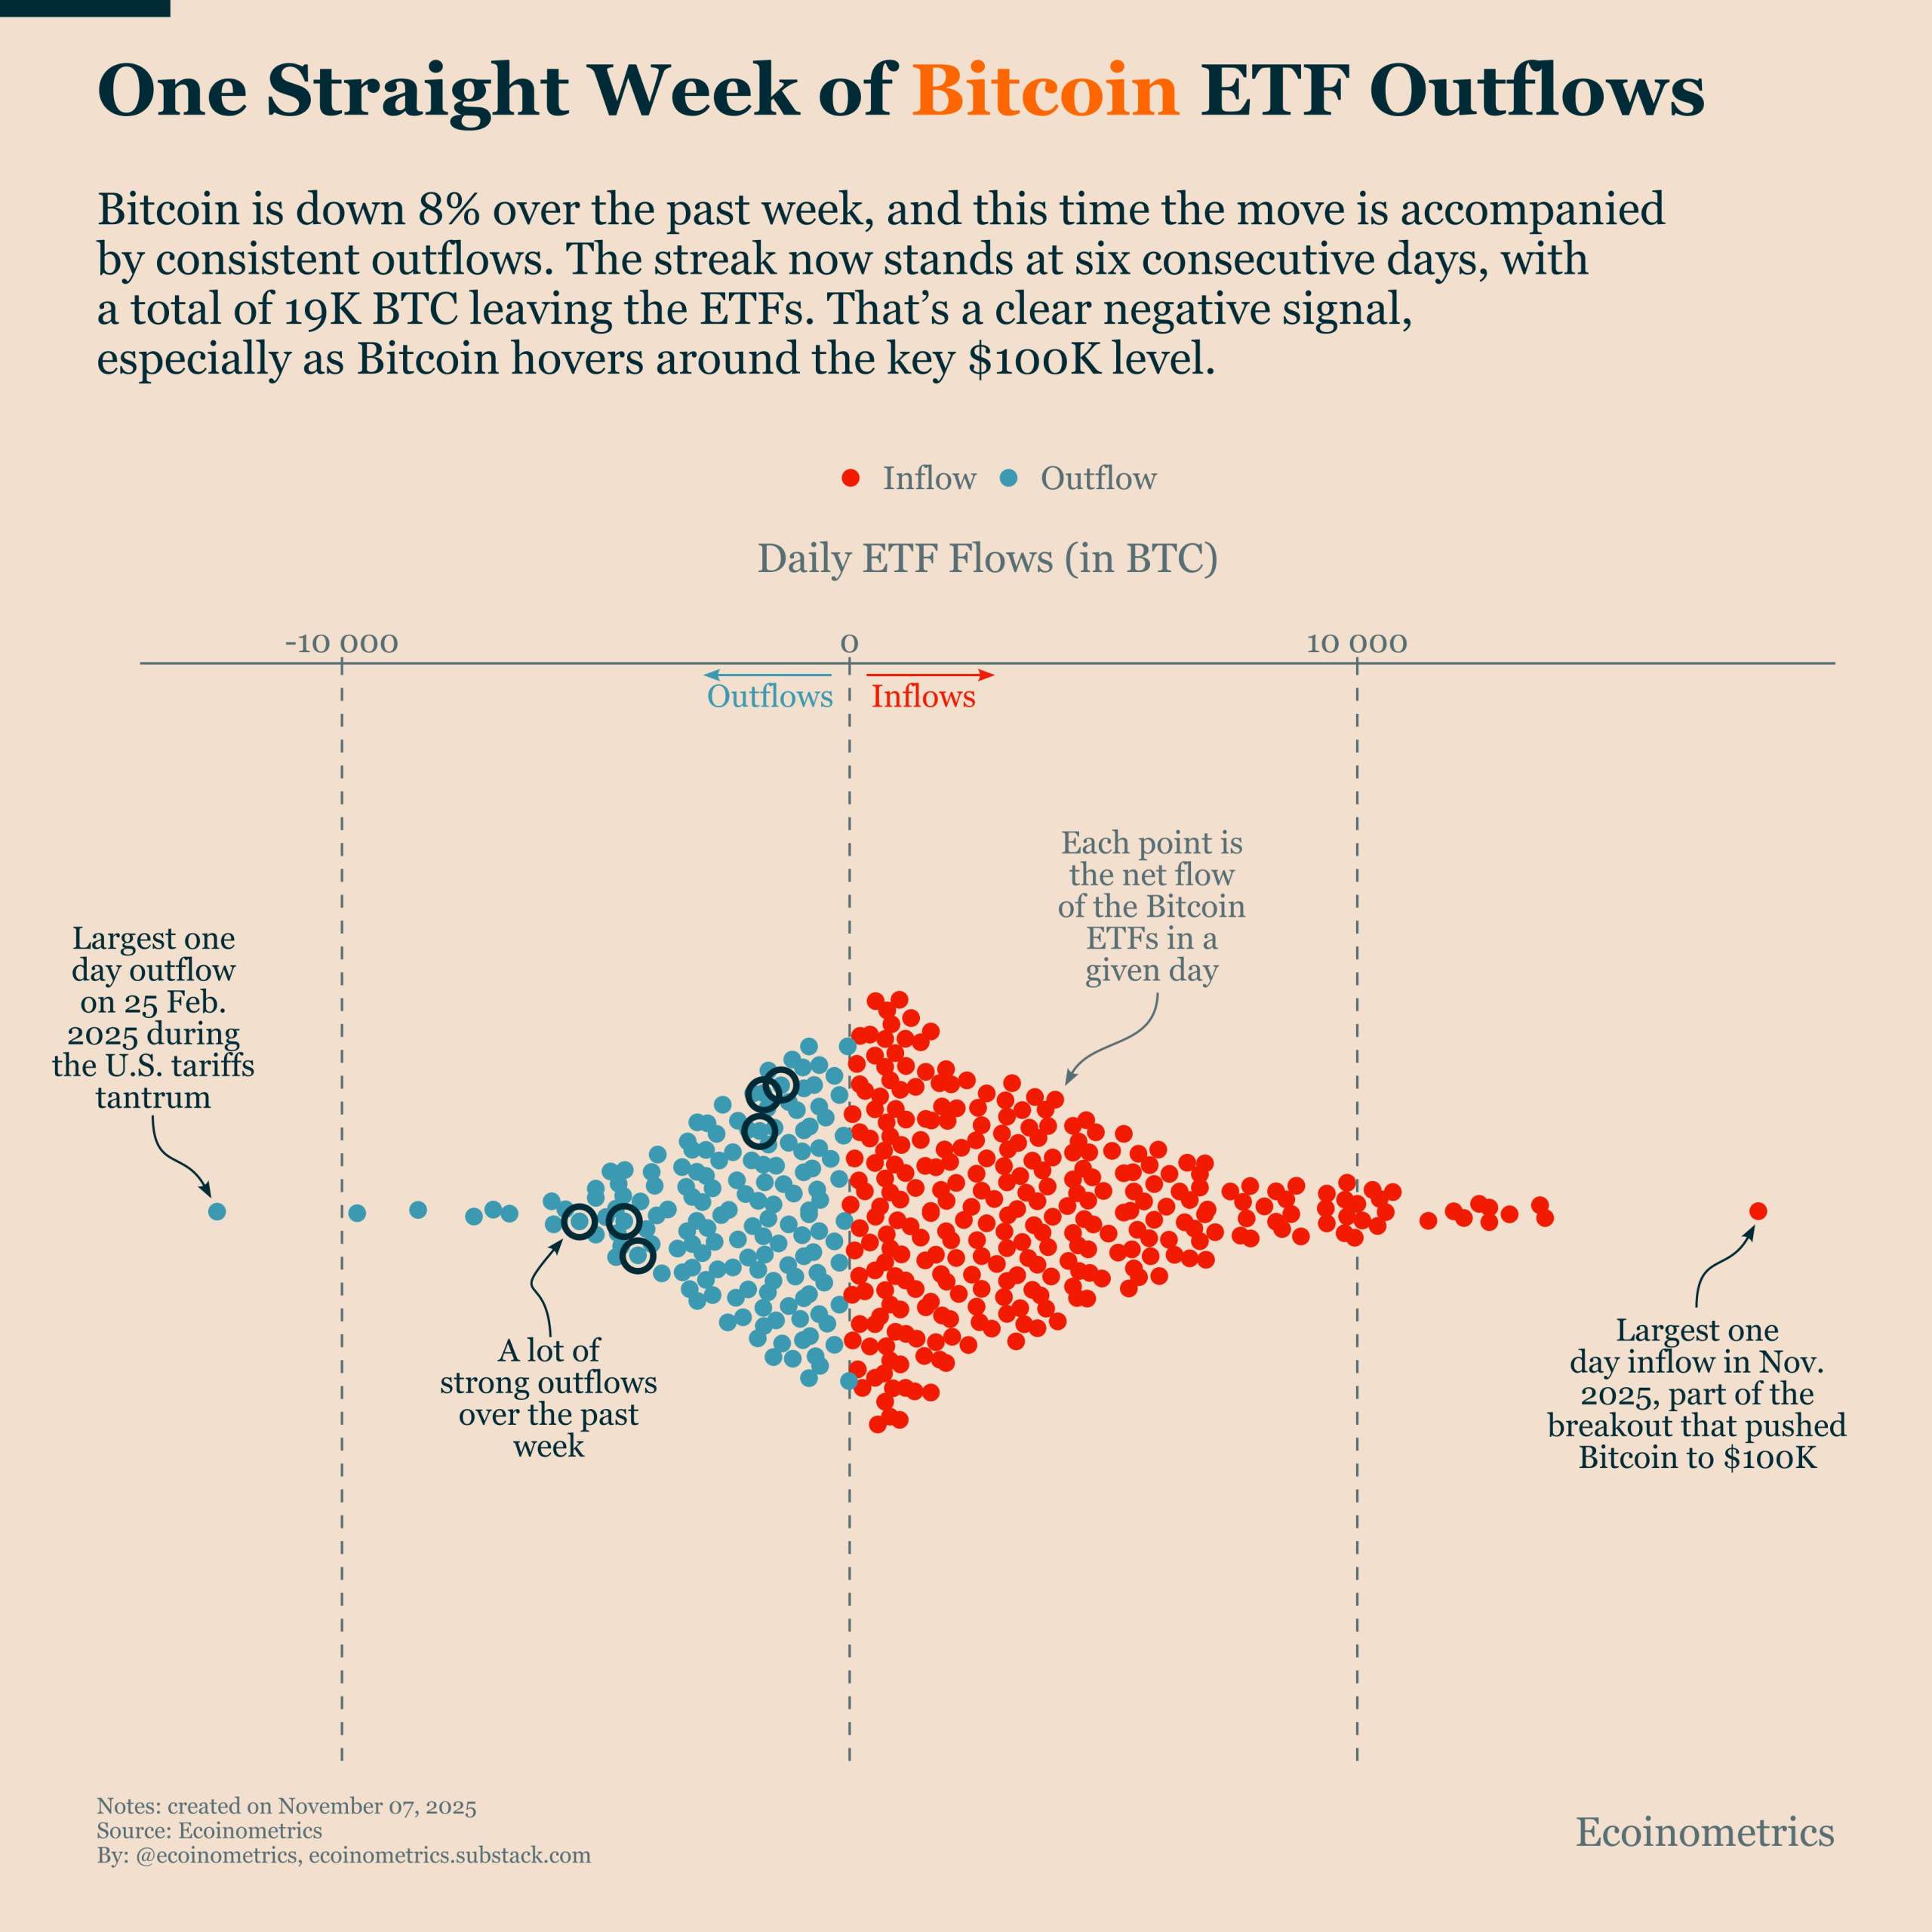
Share This Article
I. DIAGNOSTIC OF ETF FLOWS (The TradFi Tailwind)
The analysis of November 6, 2025, reveals a major strategic pivot, confirming the institutional “Buy The Dip” thesis. (a) The Washout is Over: The massive outflow of 19,000 BTC (~$2 Billion USD) over six days has effectively flushed out the weakest positions, primarily those of investors who bought at the peak of the breakout at $100k and panicked at the first correction. This forced liquidation, while painful in the short term, is a healthy market cleansing. It eliminates “weak hands” and creates a solid foundation for the rebound. The fact that the price is stabilizing around $102k after this deluge of selling is a strong sign of institutional support.
(b) The Return of the Leader (BlackRock): The entry of +2384 BTC ($92.25M), led by BlackRock’s IBIT (+922 BTC), is the most reliable signal. When the world’s largest asset manager returns to buying, it can only be interpreted as a tactical accumulation opportunity. Institutional investors see this correction not as a collapse, but as an attractive entry window.
(c) ETH: Conviction Spreads: The massive inflow into ETH ETFs (+10,789 ETH / $35.86M), particularly via the Grayscale Ethereum Mini Trust, confirms our analysis. The current crisis in the DeFi/Stream sector is perceived as an application problem, not an infrastructure problem. Institutional funds, far from fleeing, are accumulating ETH at a reduced price, betting on its long-term resilience. This strengthens the thesis that we are in an accumulation cycle preceding a major rally.
(d) Macro Surveillance: H.4.1 Report (Fed Balance Sheet): Weekly surveillance (Thursday). The necessity of disguised QE (drop in bank reserves / acceleration of SRF) needs to be confirmed. The engine of the rally is monetary policy. A sign of easing or support from the Fed would be the final catalyst to break through the resistance at $105,500.
(e) The rebound in ETF flows clearly shows that institutional capital is ready to finance the rally. The market is now waiting for the macroeconomic catalyst (the Fed Pivot) to break through the $105,500 USD resistance. Time is a critical factor: We have entered the period where Fed intervention and the CPI report (mid-November schedule) are imminent. Patience is essential, but action must be swift as soon as the signal is given.
The rebound to $102,665 USD is the signal that the market has found massive support (whale buying and absorption of Short-Term Holder liquidations). The focus shifts from defensive accumulation to tactical offensive entry.
I. VALIDATION MACRO & ON-CHAIN
The fundamental thesis is fully confirmed by the price behavior through the filter of our indicators.
- MVRV Validation: The price recovered from $99,906 USD (MVRV 1.80) without dropping into the extreme panic zone (< 1.0). This confirms that the network’s fundamental value is strong and the drop was purely a leverage washout.
- Green Light Macro: The banking liquidity crisis (SOFR/REPO) and the internal crypto crisis (Stream/Stablecoin Depeg) make Fed intervention (disguised QE) by mid-November not only probable but mandatory. This is the main driver of the rally.
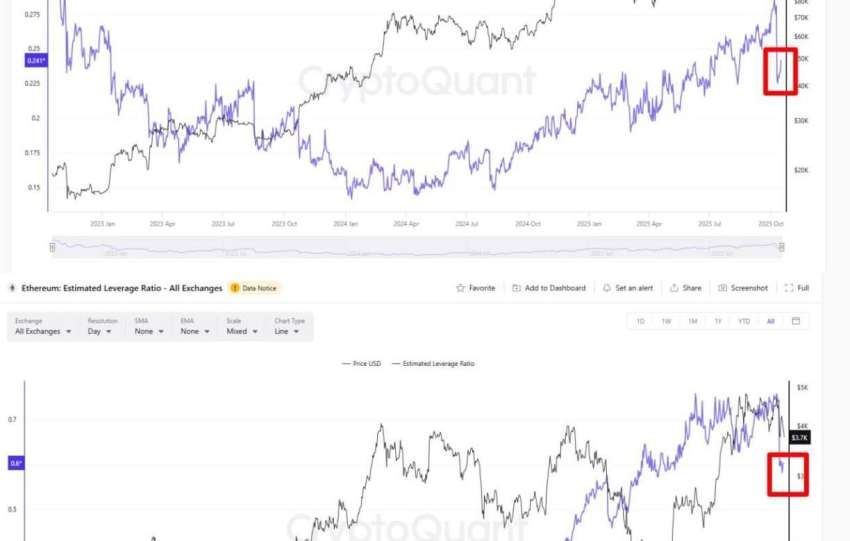
- ETH Flush: ETH has undergone its leverage flush (DeFi crisis) and now presents a massive infrastructure buying opportunity (zone $5,500 – $6,500 USD).
II. MACRO FUEL – “SHADOW QE” TRADE
| Instrument | Last | 2-week Δ | Signal |
| SOFR | 3.92 % | –18 bp | Fastest 10-day decline since Apr-20 ► repo ease = effective cut |
| Fed eff. rate | 4.25 % | flat | Spread SOFR-FF = 33 bp (top-quartile) ► unsecured stress NIL, but bank reserve glut |
| Bank reserves (H.4.1) | +24 bn $ | +1.1 % | 4 consecutive rises = shadow injection |
| RRP balance | 18 bn $ | –55 % YTD | Liquidity buffer migrating to risk |
| TGA | 48 bn $ | –120 bn since Oct-1 | Debt-ceiling resolution = forced spending |
Take-away : Net +144 bn $ of fresh settlement liquidity in 6 weeks → annualised ~10 % of M0 ; historical 2-6 week lag to BTC beta = 1.7× ► price impulse +11-14 % baked-in.
III. TECHNICAL SET-UP – SQUEEZE MAP
Chart interval : 4-hour (reduces noise vs 1H, faster trigger than daily).
- Resistance cluster : 105 300-105 800
– Deribit 24-Nov 105 k calls : 4 200 BTC OI (largest strike)
– C-basis spot-futures gap : +xx0 $ ► backwardation above 105 k = short gamma for makers - Liquidation levels (Coinglass API 08-Nov 22:00 UTC) :
– Shorts 105-106 k : 1.85 bn notional Longs 98−99k: 1.1bn - Micro-timing :
– Daily RSI : 62 (room before 70)
– MACD histogram : positive divergence for 3 days
– VPVR : low-volume node 104 800-105 200 → once broken = air pocket to 115 k
IV. ON-CHAIN CONFIRMATION – “ILLIQUIDITY SQUEEZE”
| Metric | Value | Commentary |
| LTH net position change | +47 k BTC/30d | Strong accumulation (Glassnode) |
| Exchange balance | –120 k BTC since Sept-1 | Supply sink |
| ETF net-flow (5-d avg) | +2 740 BTC/d | Institutional bid |
| MVRV | 1.80 | Not over-bought (3.0 = top-warning) |
| Funding (8-h) | +0.011 % | Neutral (no long FOMO) |
| Stablecoin ratio (SSR) | 4.2 | Money waiting on side-lines |
Interpretation : Float is shrinking while marginal demand is rising → supply-shock beta > 2× once macro spark is struck.
V. CORRELATION & CROSS-ASSET CHECK
- BTC vs Nasdaq (30-d rolling ρ) : 0.73
– Nasdaq futs P/E fwd : 28.3× (rich but not extreme)
– NVDA P/E : 49× (watch-list > 55× = rotation risk) - DXY : 103.15 (–1.2 % WoW) ► dollar weakness tail-wind
- Gold : 4 105 $/oz (ATH) → anti-fiat flow confirmed ; BTC tracking with 1.4× beta
Scenario tree :
- Soft-landing maintained (ISM 48-52) → Risk-on continues ► BTC outperforms tech 1.5×
- Hard-landing / credit event → DXY spike > 107 = abort trade (probability 15 %)