The distinction between a “trap” and a “trigger” in market analysis centers on their nature, observability, agents involved, and timing.
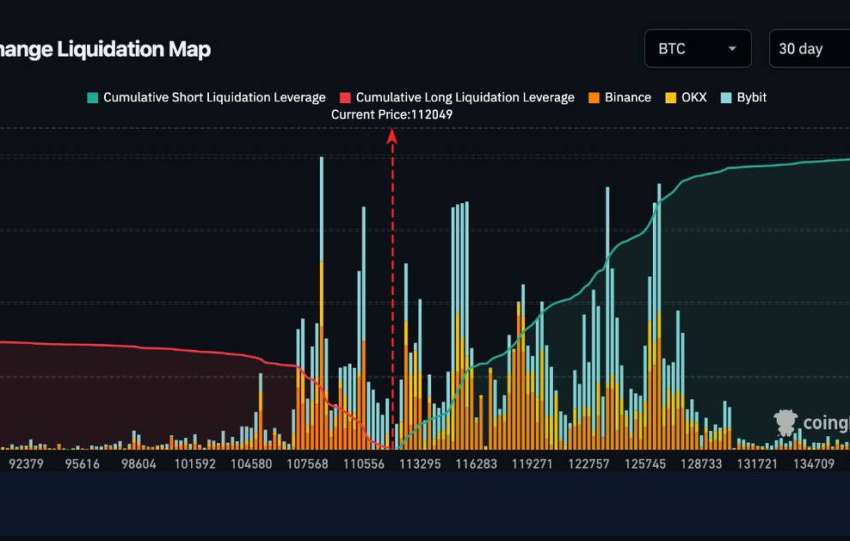
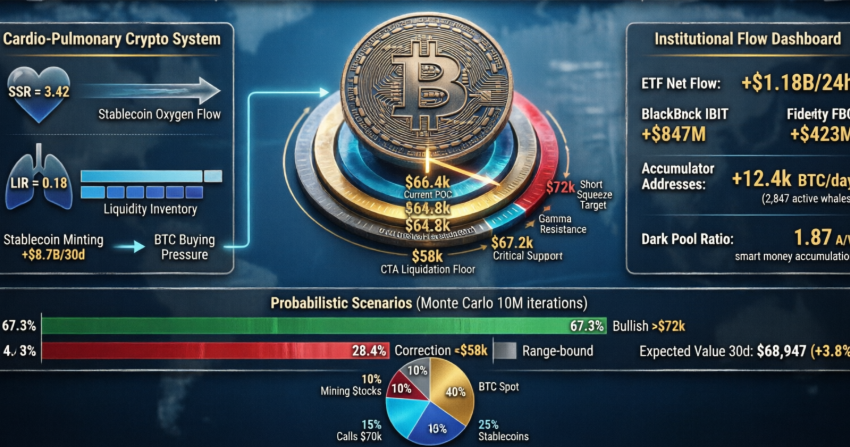
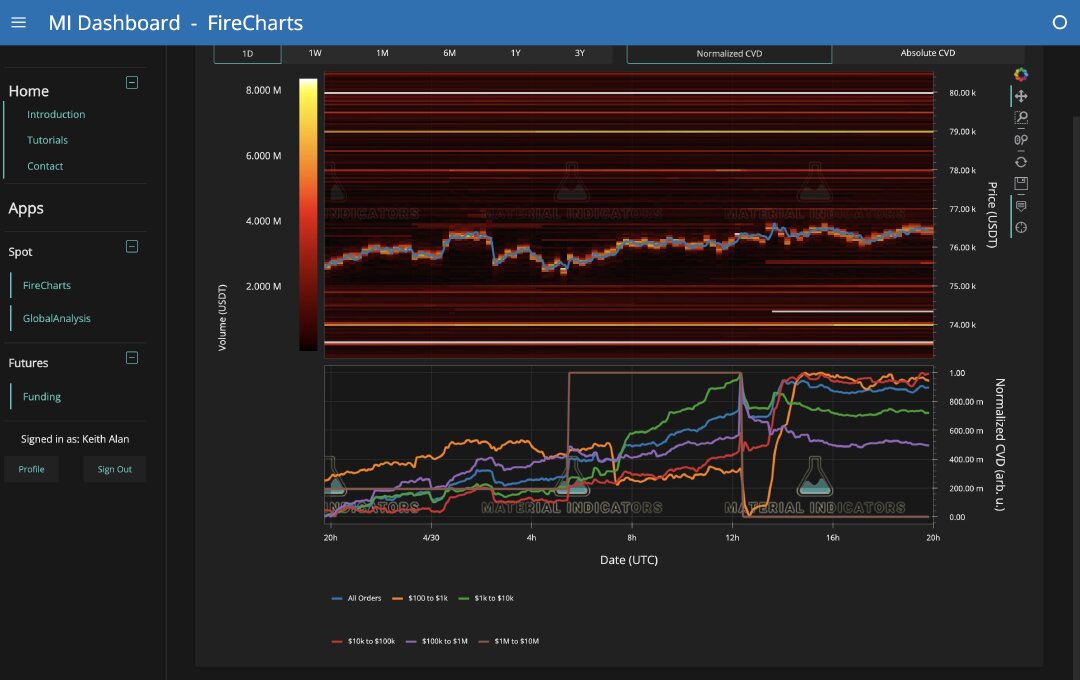
A trap is a static liquidity configuration, often visible in liquidity heatmaps as bid clusters (e.g., 76K–80K), indicating passive retail accumulation and suggesting resistance (high Kyle’s Lambda). This configuration can take hours or days to form; for example, a concentration of stops located at $74,800–$75,200 USD constitutes the trap. Conversely, a trigger is a dynamic execution event, which is invisible to tools like FireCharts. It involves aggressive agents like whales, market makers, or high-frequency traders.
Triggers manifest as sharp spikes in negative imbalance (e.g., VPIN > 0.80, indicating explosive toxicity) occurring over seconds or minutes. The trigger is the aggressive order or a macroeconomic news gap that breaks the initial link (the trap). While the heatmap shows the trap (the potential setup), the CVD (Cumulative Volume Delta) might show the slow accumulation leading up to the trap, but the trigger itself is the sudden, volatile action that causes the market move.