Skip to content Skip to sidebar Skip to footer

Tag: Gold

Stock analysis workspace featuring charts, a calculator, and currency for data-driven insights.

Decline of Sovereign Bonds as a Safe-Haven Asset and Rotation Toward Gold

Summary: Since 2021, the US bond market has experienced upward pressure on yields, with the stock-bond correlation turning positive. Several institutions (Morgan Stanley, Osaic, Sagard) have officially reduced their allocation to fixed income in favor of gold and real assets. This study models this regime change using a two-state HMM, GARCH volatility, and a Merton…
Read more

Digital art showcasing a 3D abstraction of golden floating cubes with a soft blurred background.

Gold Projected to Reach $5,000

https://www.steelldy-indices.com Aakash Doshi (State Street) predicts that gold's next $1,000 move will be upward, with consolidation around $4,000 before expanding to $4,750–$5,500. This forecast aligns perfectly with our proprietary quantitative models. By integrating market data, institutional flows, and geopolitical signals through M. Theory 4.2 and leveraging Steelldy Risk Engine 12.4 and Quantum-Classical Hybrid 1.0 on…

Read more

A close-up image of various world coins in a pile, highlighting different currencies.

War, Hidden Inflation, and the Role of Gold and Silver as Monetary Anchors

https://www.steelldy-indices.com/https://www.steelldy-indices.com The persistence of armed conflicts (Ukraine, Iran, tensions in Asia) and disruptions in energy supply, analyzed in our previous articles (ST-0726-IRAN-GOLD, ST-0727-CHINA-GOLD), validate a fundamental premise of quantitative finance: wars are the primary driver of debt monetization and hidden inflation that erodes savers' wealth. Faced with a deficit in traditional financing (tax collection, bond…

Read more

Illuminated Türkiye İş Bankası building in Ankara, Türkiye at night with vehicle motion blur.

Gold Holds Near $4,100 as Geopolitical Pause Eases Sovereign Selling Pressure

https://www.steelldy-indices.com Current gold price is around $4,100-4,103/oz, with a neutral-to-bullish short-term stance but an intact seller regime risk. The divergence alert between the model and Polymarket is not triggered. Semantic NLP shows a "gold distrust" score of 0.48 (down from 0.62), with dominant themes being the Fed decision, US-Iran pause, oil easing, and PBOC purchases.…

Read more

Toy soldiers and Iran flag on a world map symbolizing geopolitical tensions.

How the War with Iran Is Shaking Central Bank Confidence in Gold Reserves

https://www.steelldy-indices.com The Iran-United States war, triggered in Q1 2026, introduced a second-order exogenous shock to the gold market, destabilizing the strongest pillar of the decade-long bull run: central bank demand. The announcement of the suspension of gold sales by the Azerbaijani sovereign wealth fund (SOFAZ), forced sales by Turkey and Russia, and the contraction of…

Read more

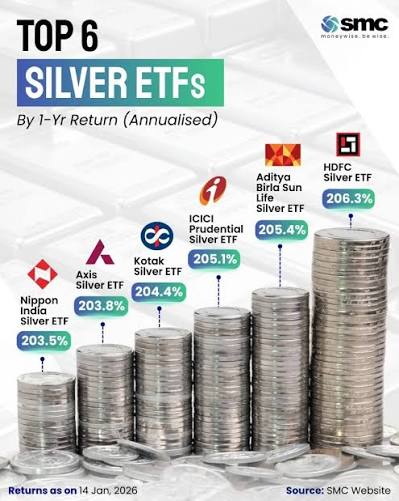
Silver ETFs: Advantages, Disadvantages, and What Investors Should Know

https://scoregex.streamlit.app Silver exchange-traded funds (ETFs) have surged in popularity among investors seeking exposure to precious metals due to their ease of access, tradeability, and storage convenience. However, while these financial instruments offer undeniable benefits, they also come with significant drawbacks compared to owning physical silver. Understanding the fundamental differences between silver ETFs, which provide indirect…

Read more

Close-up of Canadian coins in a monochrome color scheme, depicting wealth and currency.

Silver Tumbles 3.8% as Dual Demand Crumbles Under Hawkish Fed Pressure

https://www.steelldy-indices.com Silver experienced a notable decline on July 13, 2026, dropping by 3.8%, surpassing gold’s decrease of 2.9% on the same day. This divergence pushed the gold-to-silver ratio to an elevated level of 69.4. Far from being an isolated event, this relative underperformance highlights silver’s unique dual character | as both a monetary asset and…

Read more

Close-up of a printed stock market report in black and white, highlighting stock prices.

COMEX Silver Inventory Crunch Intensifies. July Deliveries Devour 31% of Registered Stock

https://www.steelldy-indices.com Silver (XAG) is undergoing a severe correction phase since its peak in January 2026 (~$120/oz) down to current levels of $58 (Western spot) and $64.79 (Shanghai). This 52% retracement reflects a conflict between strong physical fundamentals (green industrial demand, COMEX inventories under pressure) and macroeconomic headwinds (hawkish Fed, strong dollar, Iran ceasefire). Data…

Read more