https://www.steelldy-indices.com
Aakash Doshi (State Street) predicts that gold's next $1,000 move will be upward, with consolidation around $4,000 before expanding to $4,750–$5,500. This forecast aligns perfectly with our proprietary quantitative models. By integrating market data, institutional flows, and geopolitical signals through M. Theory 4.2 and leveraging Steelldy Risk Engine 12.4 and Quantum-Classical Hybrid 1.0 on…

https://www.steelldy-indices.com/https://www.steelldy-indices.com
The persistence of armed conflicts (Ukraine, Iran, tensions in Asia) and disruptions in energy supply, analyzed in our previous articles (ST-0726-IRAN-GOLD, ST-0727-CHINA-GOLD), validate a fundamental premise of quantitative finance: wars are the primary driver of debt monetization and hidden inflation that erodes savers' wealth. Faced with a deficit in traditional financing (tax collection, bond…
https://www.steelldy-indices.com
The decision of several major Chinese banks (ICBC, Ping An, China Guangfa) to suspend precious metals trading services linked to the Shanghai Gold Exchange (SGE) for individuals, by drastically raising margin requirements to 140%, is not a simple prudential adjustment.
Analyzed through M. Theory 4.2 and the Steelldy 3.8 graph engine, this measure…
https://www.steelldy-indices.com
Current gold price is around $4,100-4,103/oz, with a neutral-to-bullish short-term stance but an intact seller regime risk. The divergence alert between the model and Polymarket is not triggered. Semantic NLP shows a "gold distrust" score of 0.48 (down from 0.62), with dominant themes being the Fed decision, US-Iran pause, oil easing, and PBOC purchases.…
Uniswap (UNI) has re-emerged with renewed institutional narrative momentum following Standard Chartered’s 15 June 2026 initiation of coverage, targeting $100 by end-2030 (~35–40x from ~$2.50–2.70 base; staged path: $6.50 EOY2026, $20 2027, $40 2028, $65 2029). The thesis hinges on tokenized Real-World Assets (RWAs) driving DeFi TVL to ~$2.7T (37x expansion) and Uniswap capturing dominant…
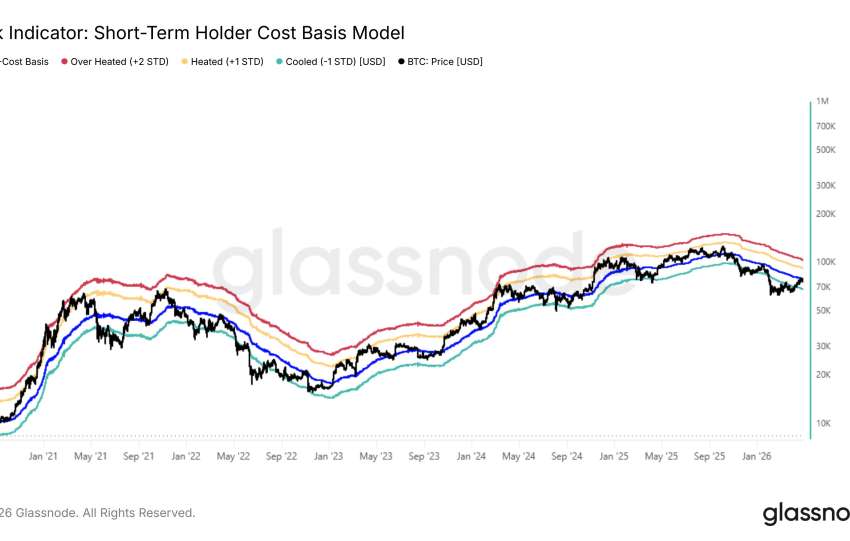
Analysis of Glassnode data as of April 30, 2026, reveals an unprecedented structural compression: Bitcoin is "trapped below market mean," trading at approximately $76,000, below the True Market Mean (around $81,500) and the STH Cost Basis (around $83,000), in a "Cooled" zone (-1σ). The Spot Volume Delta (7-day MA) indicates a stabilization of net selling…
Or et argent : pourquoi la baisse de vendredi (30 janvier) n’est qu’un “recul” et non l’effondrement
Bayron King aborde la chute brutale des prix de l'or, de l'argent, des métaux et des actions minières survenue un vendredi, en la comparant de manière ironique à la tradition américaine de la Chandeleur (Groundhog Day). Il souligne que, tout comme la prédiction du raton laveur est une devinette météorologique, l'explication de la chute des…
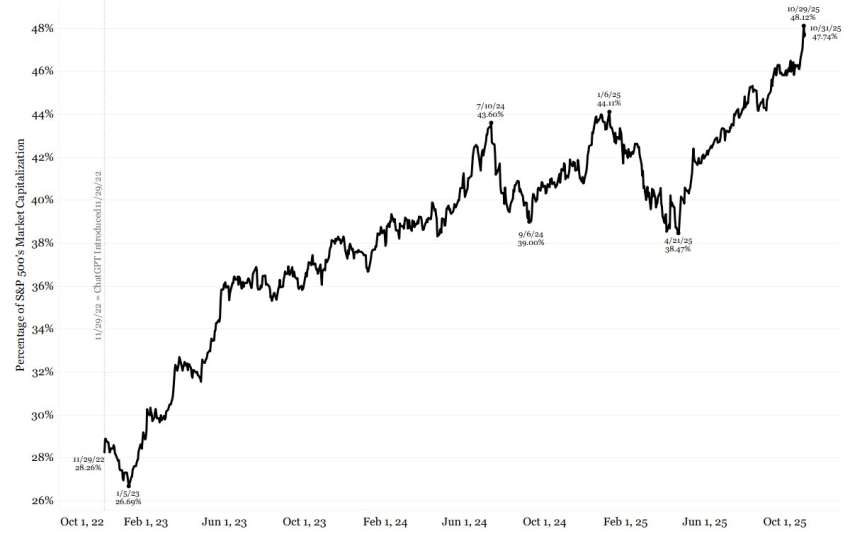
Notre analyse introduit une narration contrariante essentielle (Jim Bianco/Trump) qui oblige à affiner notre analyse du risque de la bulle de l'IA. Le graphique confirme l'extrême concentration thématique du S&P 500 (SPX) à 47,7% dans 41 actions liées à l'IA .
Nous devons croiser cette concentration record…
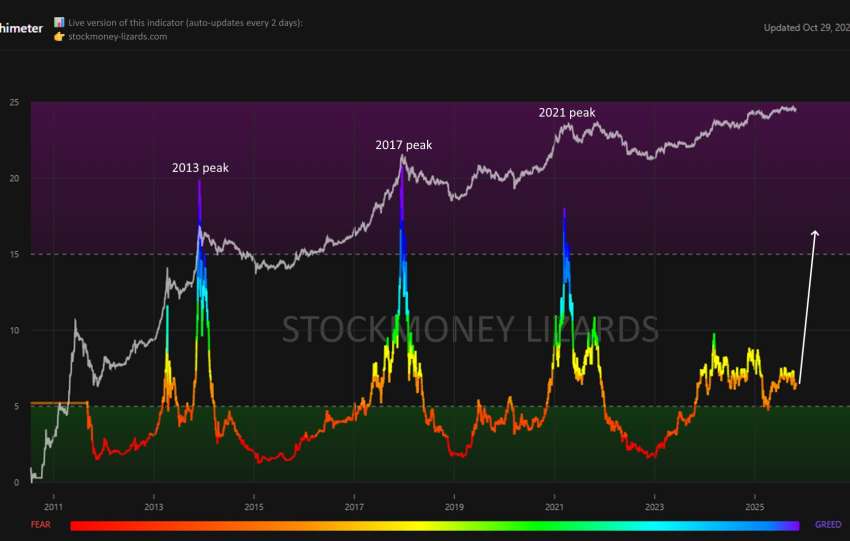
1. La mise à jour du Satoshimètre de Stockmoney Lizards, un indicateur technique/on-chain propriétaire, signale un puissant soutien à la thèse d'un "Blow-Off Top" imminent pour le Bitcoin, réfutant l'idée d'un sommet de cycle prématuré.
2. Historiquement, les sommets de cycle (2013, 2017, 2021) sont atteints lorsque le Satoshimètre se situe entre 18 et…
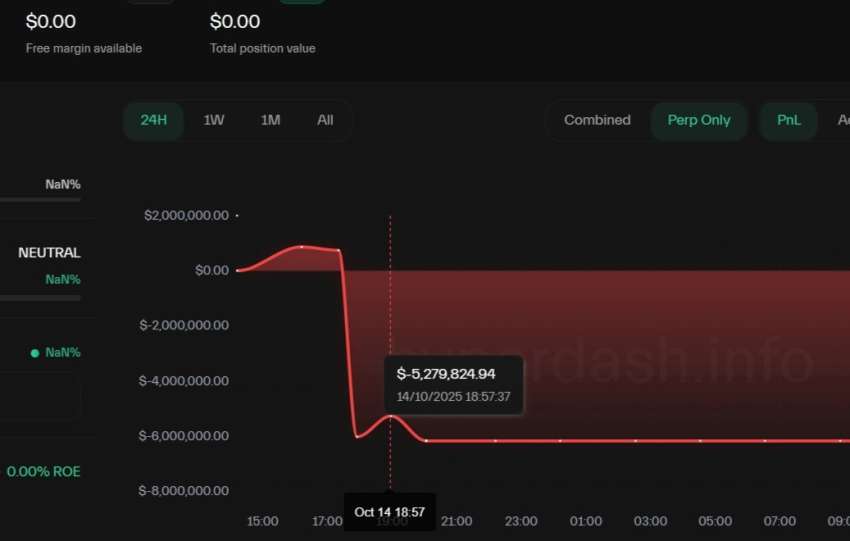
Du sommet du Profit Short au retour en CASH après une perte.
Voici une synthèse de ce qui s’est passé et de ce qui va probablement se passer ( avec les preuves visuelles ) :
SYNTHESE : LE JEU DE L’HYPERUNIT WHALE
I. CE QUI S’EST PASSE : CLOTURE ET MISE EN PAUSE
L'OG…
Analyse de marché