Visual Data:
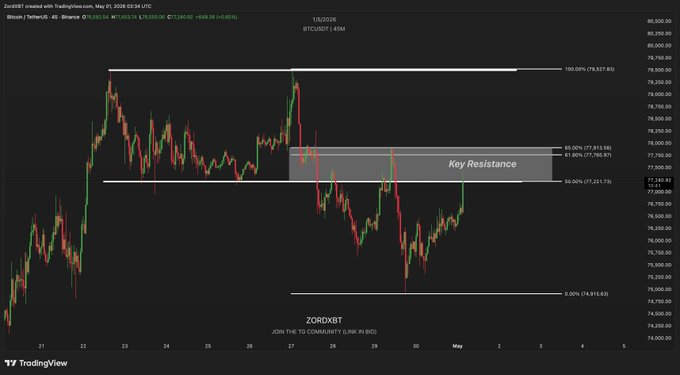
¤ Clear resistance zone between $77,400 and $78,000 USD.
¤ Fibonacci 65% at $77,411 USD, 61.8% at $77,196 USD.
¤ Current price below resistance.
Correlation with the April 27th Study: The April 27th study identified the selling wall at $79,000–$80,000…
Current microstructural analysis reveals a terminal disconnection between "Lit" markets (transparent/ETF) and dark pools (ATS). While massive outflows from ETFs (such as SLV/GLD) create visible downward pressure, our Steelldy SLV algorithms identify aggressive accumulation by Asian sovereign wealth funds (SWFs) via iceberg order blocks in alternative trading systems. This is not a simple price correction…
Analyse de marché