Visual Data
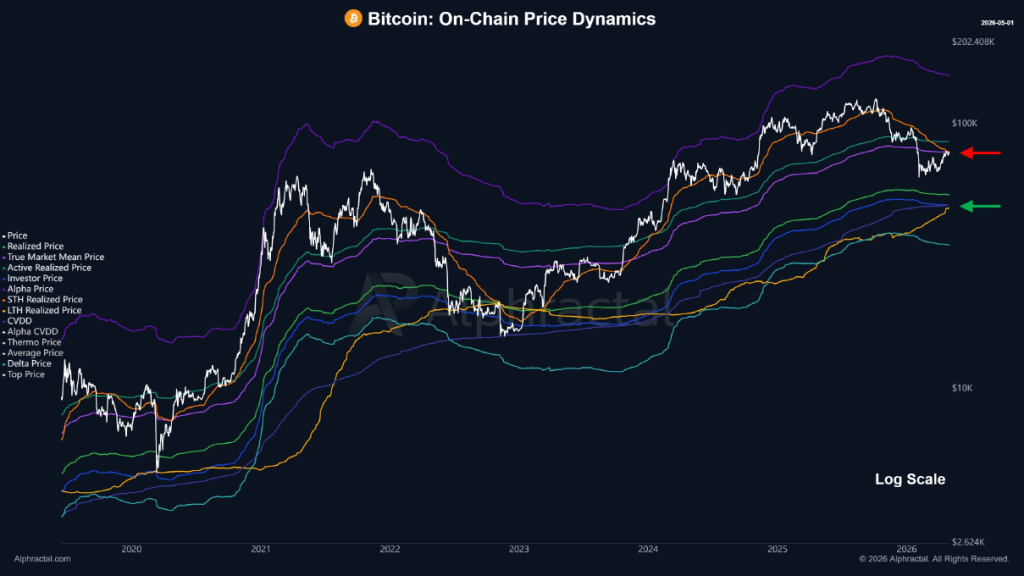
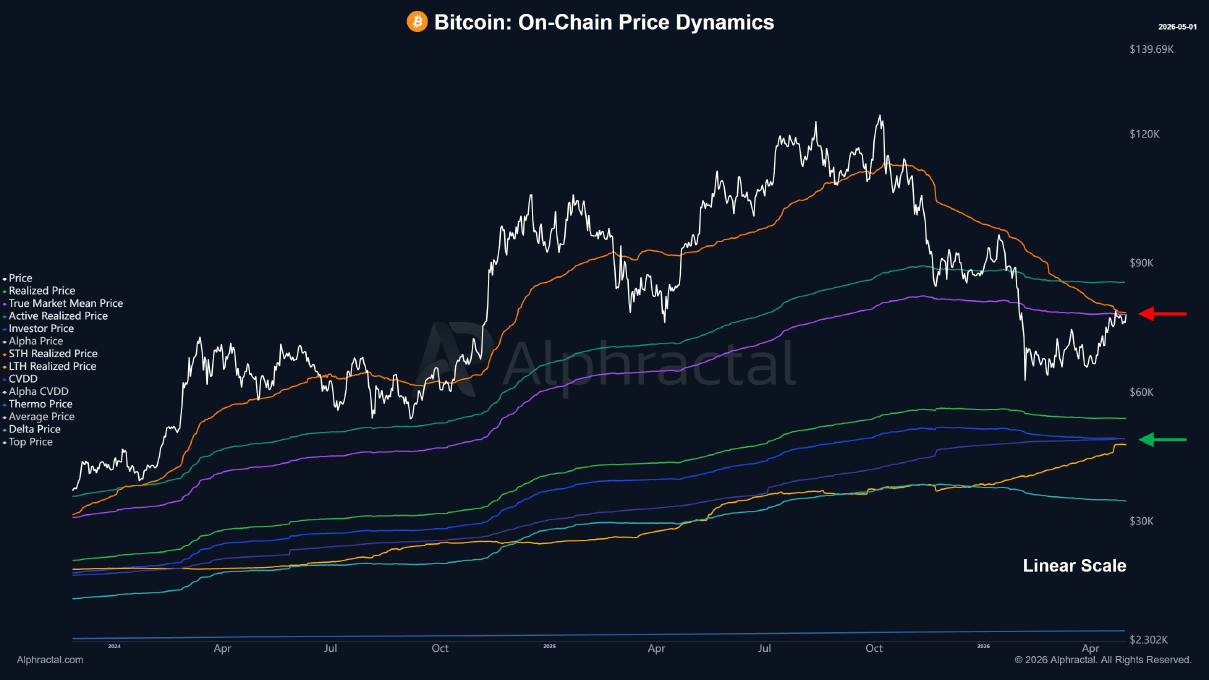
Red arrow: resistance cluster at $78,000–$80,000 (confluence of Realized Price, True Market Mean Price, Active Realized Price, Investor Price, STH Realized Price).
Green arrow: structural support cluster at $45,000–$50,000 (LTH Realized Price, CVDD, Delta Price, Average Price). The current price is positioned at the level of the red arrow, testing the resistance from below.
Correlation with the May 1, 2026 study: Our study yesterday identified the resistance wall at $77,400–$80,000 (ZORDXBT 4H, Hyperliquid whale). Alphractal confirms that this wall is structurally on-chain, not just technical. The new element is the green arrow: the next major support is not $68,000 (May 1st hypothesis) nor $72,000 (CME cluster), but the $45,000–$50,000 cluster.
Quantitative Implication: In Alphractal’s On-Chain Price Dynamics (OPD) model, the price is modeled as a diffusion process between realized bands:
Where:
¤ STHRP (STH Realized Price) = ~$78,000 USD (resistance)
¤ LTHRP (LTH Realized Price) = ~$48,000 USD (structural support)
¤ α = reversion coefficient (0.62 in a stress regime).
The price distance/STHRP ($1,700 above) is less than the price distance/LTHRP ($29,000 below), creating a reversion asymmetry favorable to bears. The Realized Cap does not show significant inflow, confirming the absence of new entrants at these levels.